Key Points
- There was a slight increase in the total market with dealers growing from 4,217 to 4,263 and rooftops from 7,321 to 7,362 between 17th and 24th February 2024.
- The average Days on Market (DoM) remained consistent at 72 days across the two periods.
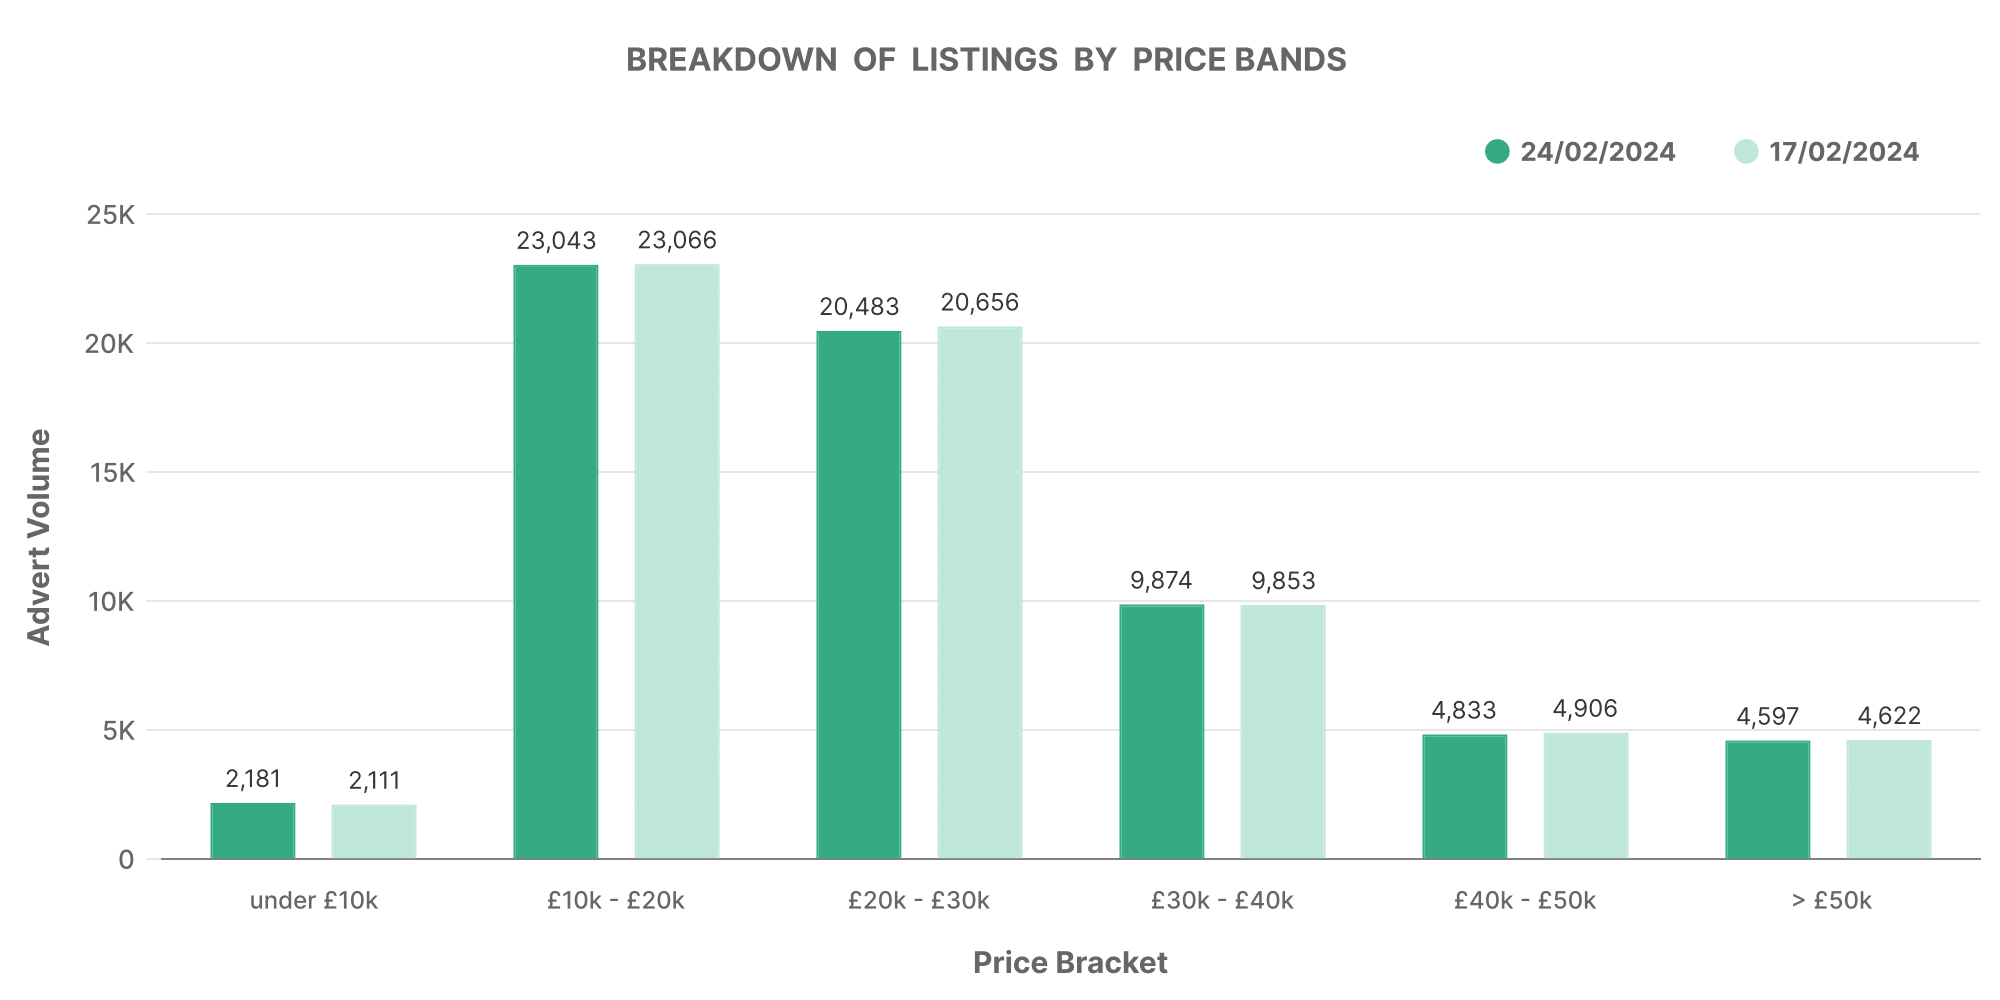
- The breakdown of listings by bands showed a slight increase in the under £10,000 category and a dip in the £10,001-£20,000 and £20,001-£30,000 bands.
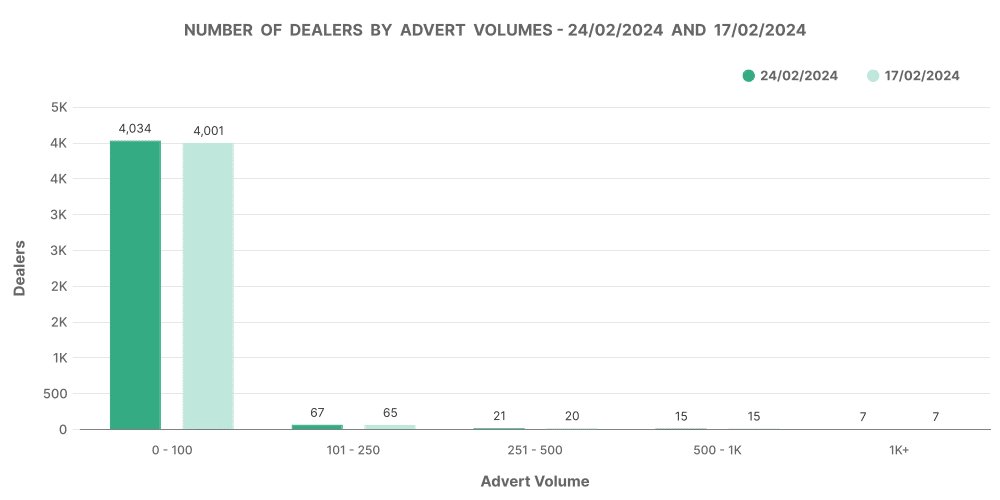
- In terms of advert volumes, there were slight changes within the less than 100 adverts and 101-250 adverts categories, remaining consistent elsewhere.
- There were minor revisions to advertisement prices with both increases and decreases in prices observed during the period under review.
Total Market Analysis
The total market for electric cars saw a modest growth from the period between 17th to 24th February 2024. The number of dealers rose from 4,217 to 4,263, which is a 1.1% increase. Similarly, the quantity of rooftops increased to 7,362 from 7,321 recording a 0.6% increase. However, the average price of car listings slightly decreased by £62, from £27,975 to £27,913.
Days on Market (DoM) Average
The average Days on Market (DoM), indicating how long listings stay on the market, remained constant at 72 days. This statistic suggests a steady rate of car turnover during this period.
Breakdown of Listings by Price Bands
In the breakdown of listings by price bands, there was mostly a slight decrease in all bands except for vehicles priced below £10,000 and those between £30,001 and £40,000 which saw a slight increase. The band with the highest number of listings was £10,001-£20,000, despite showing a slight decline.

Number of Dealers by Advert Volumes
Looking at dealers’ advertising volumes, the amount of dealers with less than 100 adverts rose slightly from 4,001 to 4,034. The same trend was observed in the 101-250 adverts category.

Analysis of Top 100 Dealers by Volume
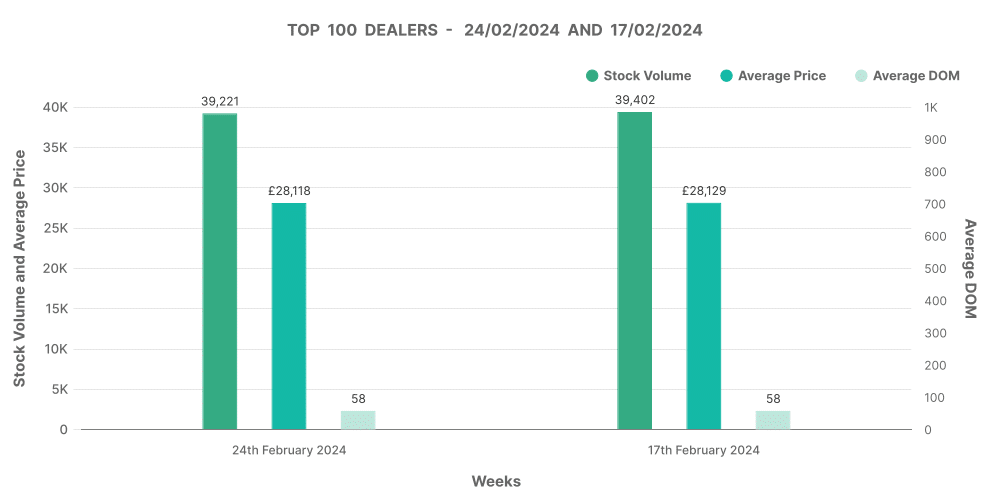
For the top 100 dealers by volume, both stock volumes and average price showed a slight decrease from 39,402 to 39,221 and from £28,129 to £28,118 respectively, signalling a marginal drop in dealer activity.

Price revision data – changes to advert prices
Advertisement price revisions during this period were bi-directional. There was an increase in some advert prices, 2,628 rising to 3,885 and simultaneously, a decrease in other advert prices, from 12,730 to 12,429.
Conclusion
In conclusion, the data for the electric cars market for the period between 17th to 24th February 2024 showed small fluctuations in various sectors. Although, the market demonstrated overall stability with minor growth in certain areas.
Request a free data trial with Marketcheck UK
Next week: 2nd March | Previous week: 17th February
