Introduction
Understanding the UK’s used car market trends and data can significantly impact decision-making for automotive dealers. This week, we delve into the latest market data, highlighting how Marketcheck UK’s comprehensive insights can guide dealers in navigating the complexities of the automotive market.
Understanding the Latest UK Car Price Trends
Automotive Market Insights
The past week’s data provides valuable insights into the used car market landscape. With a slight increase in total listings from 838,616 to 862,298, the market shows a growing inventory. Interestingly, the average ‘days on market’ (DOM) has decreased from 86 to 84 days, indicating a quicker turnover of vehicles.
Price Band Analysis
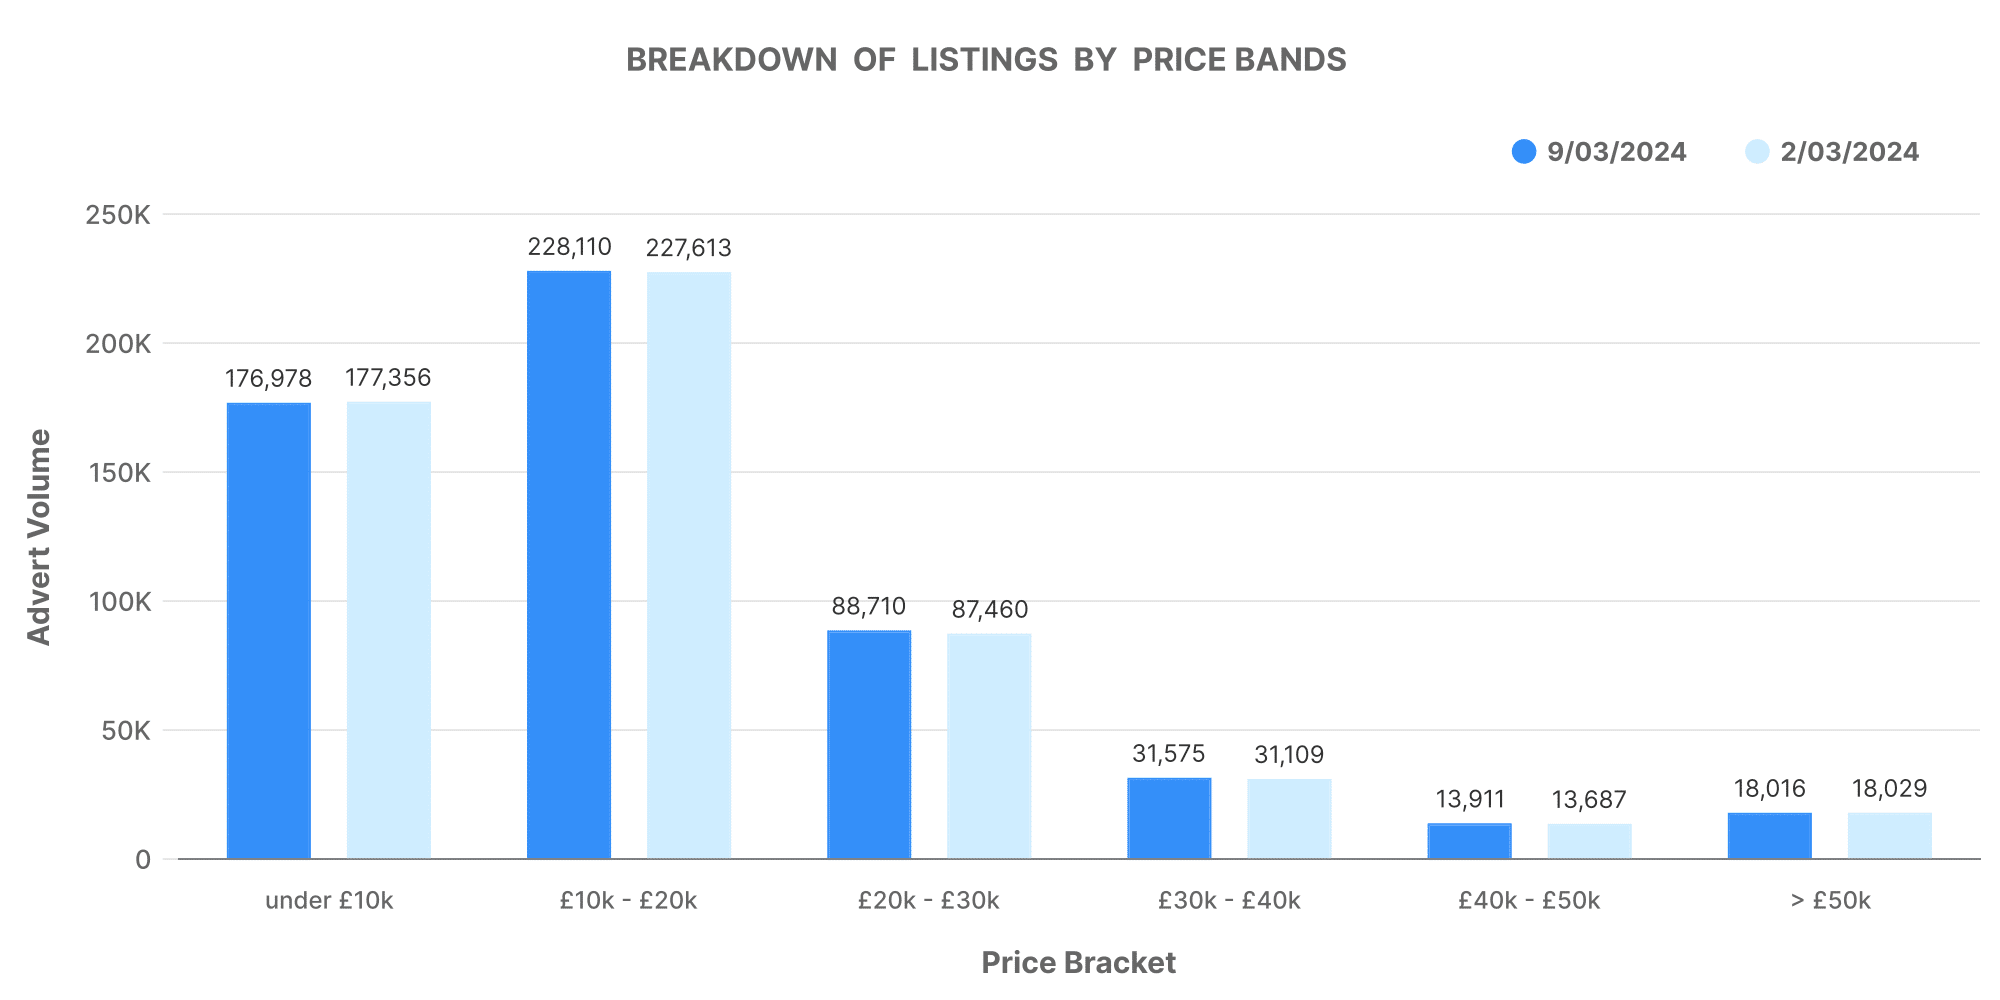
An in-depth look at the price band volumes reveals a consistent demand across various segments. The 10-20K and 20-30K price bands remain popular, reflecting a steady consumer interest in mid-range vehicles. Dealers should note the slight uptick in the 50K+ segment, suggesting a growing niche market for high-end vehicles.
Breakdown of Listings by Price Bands
The graph illustrates the distribution of listings across different price bands. Notably, the 0-10K and 10-20K bands dominate the market, but the subtle growth in the 50K+ band shouldn’t be overlooked. This could indicate an emerging opportunity for dealers specialising in luxury cars.

Dealer Insights and Inventory Strategies
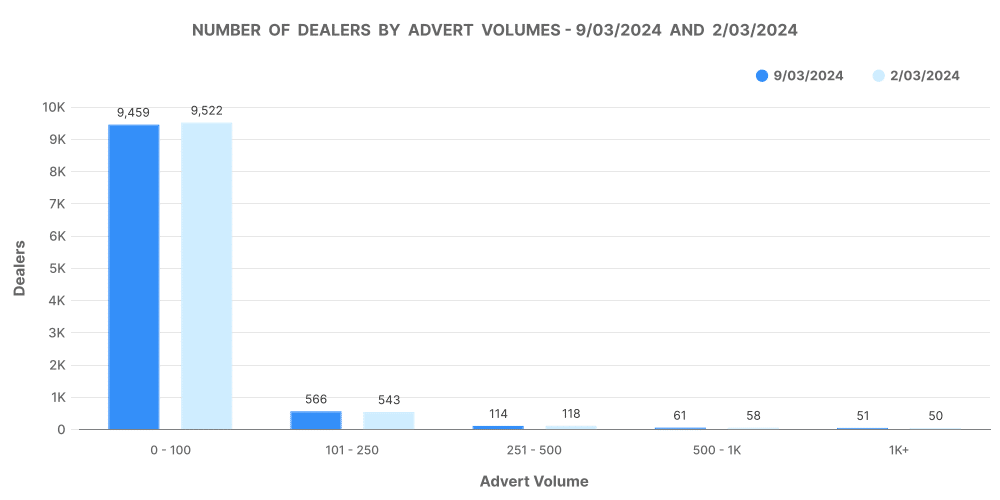
Number of Dealers and Advert Volumes
While the number of dealers has seen a minor decrease, the overall advert volume has increased, suggesting that remaining dealers are listing more vehicles. This could be a strategic response to the growing demand, highlighting the importance of adjusting inventory levels to market conditions.
Number of Dealers by Advert Volumes
The graph showcases the relationship between the number of dealers and their advert volumes. A closer look reveals that while some dealers are expanding their listings, others may be consolidating, indicating varied strategies in the market.

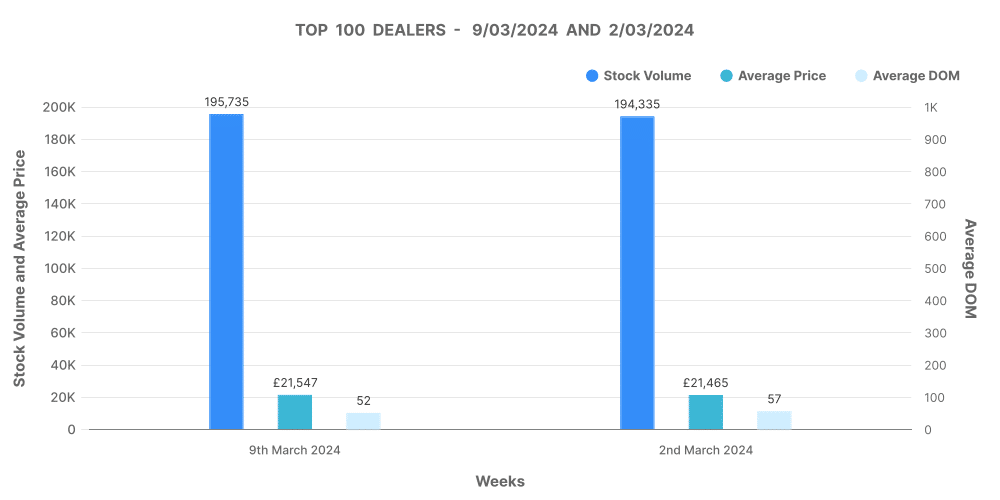
Top 100 Dealers: A Focused Look
The top 100 dealers have demonstrated a quicker turnaround with a decrease in average DOM from 57 to 52 days. However, their average price has slightly increased, suggesting a focus on higher-value inventory or effective pricing strategies.
Analysis of Top 100 Dealers by Volume
This graph provides insights into the stock volume and pricing strategies of the top 100 dealers. Noticing the balance between price increases and decreases can offer strategic insights for other dealers aiming to optimise their inventory management.

Leveraging Data for Strategic Advantage
Marketcheck UK empowers dealers with real-time data and analytics, enabling them to make informed decisions. Whether it’s adjusting pricing, understanding market demand, or optimising inventory, our tools provide the insights you need to stay competitive.
Next week: 16th March | Previous week: 2nd March
