UK Monthly Used Car Market Data – August 2024
In the compelling game of the used car market, staying nimble is the key to success. The UK has positioned itself as a lively player with a fast-paced, ever-evolving market, requiring automotive dealers to keep their eyes peeled and ears to the ground. With new insights into the Used car market and the Electric used car market, we’ll break down the latest UK car price trends and other intriguing automotive market insights that will drive you forward in this rapidly evolving industry.
The Bigger Picture: Analyzing The Used Car Market
Reports from October and November 2024 reveal some interesting statistics about the UK’s internal combustion engine (ICE) market—providing some invaluable context for car dealers vying for a competitive edge in the pre-owned vehicle marketplace.
Riveting through the data, the total number of UK dealers dipped from 10,793 in October to 10,680 in November, representing a minor reduction in market participation. This coincided with a marginal increase in the total number of used ICE car listings, from 804,253 in October to 819,854 in November—a clear indication of a persistently lively marketplace.
Let’s swerve to the Average Days on Market (DOM) metric—an effective measure of how long cars are taking to sell from the day they’re listed. The data points to a DOM increase from 77 to 79 days within the same month, suggesting a lengthened selling cycle. However, the average price for a used ICE vehicle held steady at about £17,950—indicating the market’s resilience amid these fluctuations.
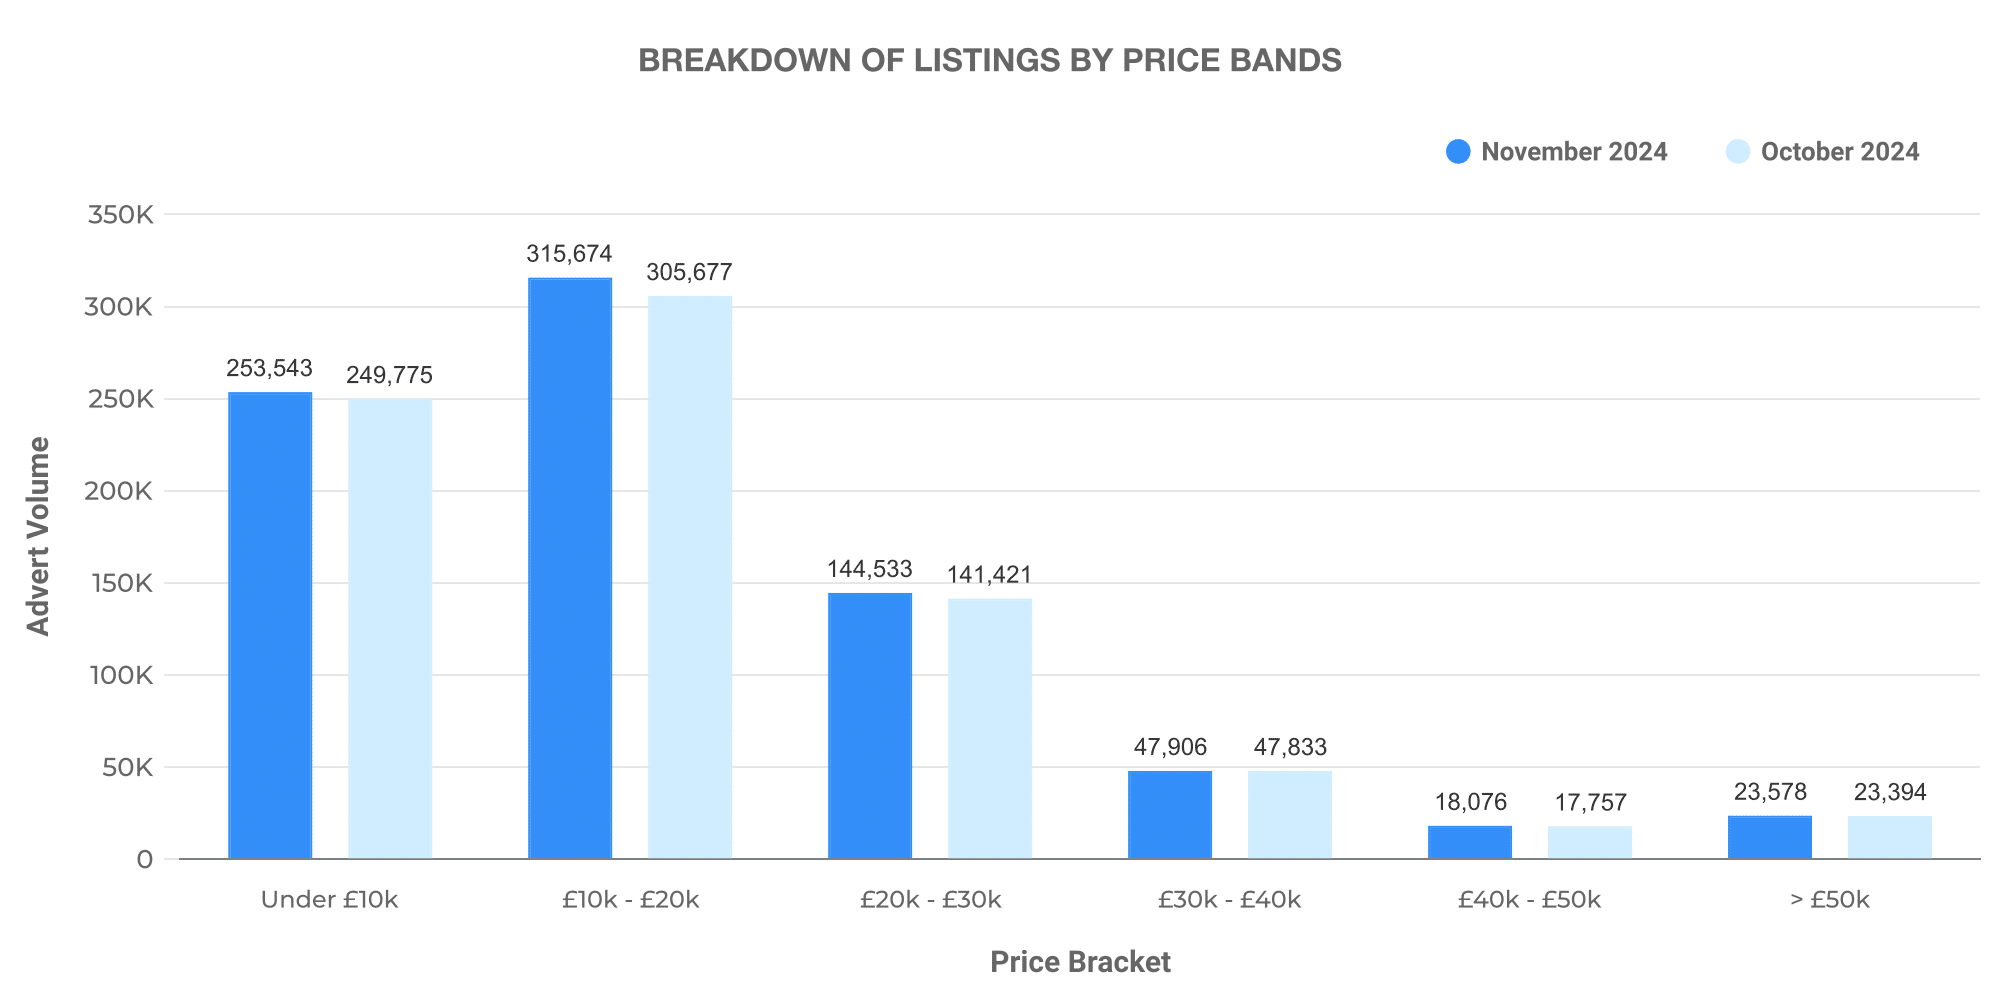
Diving into price band volumes, cars falling within the £10-20k bracket dominated in both months, with 305,677 in October and 315,674 in November. This was closely followed by the £0-10k price band, underlining a persistent consumer preference for more affordable used cars.
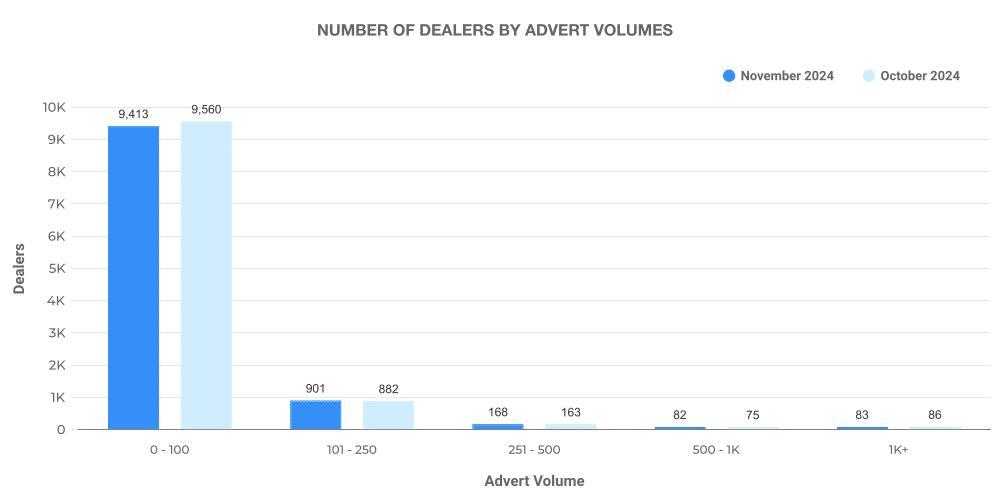
When it comes to dealer advertising volumes, the majority fell within the 0-100 adverts band, highlighting the dominance of small-scale dealers in the UK’s used car market.
Home Straight: The Top 100
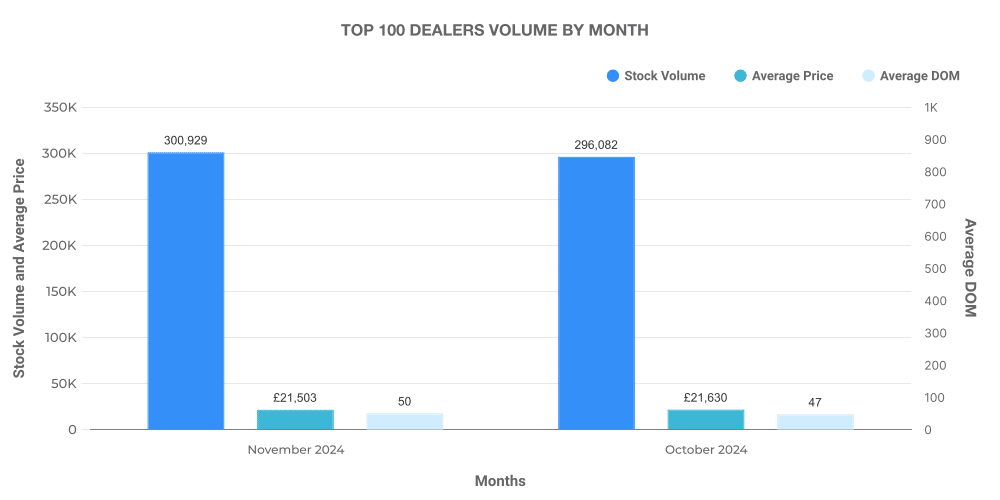
Speaking of power players, the top 100 dealers accounted for a significant chunk of the used ICE car market. October saw this group boasting a stock volume of 296,082, which rose to 300,929 in November. Their DOM was slightly lower than the industry average, settling around the 47-50 days mark, indicating these big dealers’ superior effectiveness in turning their stock.
The Electric Curve: Navigating the EV Market
Let’s shift gears and explore the electrifying realm of the used electric vehicle (EV) market. As the UK surges forward in its green revolution, more dealers are dabbling in electric cars, triggering substantial competition and investment opportunities.
In terms of total EV dealer numbers, we observed a growing enthusiasm with an increase from 4718 to 4792 between October and November. What stirred the market, even more, was the leap in total EV car listings, from 98,944 to 104,889 in the same period—an upsurge reflecting the growing consumer interest in sustainable transport alternatives.
But what’s the hold-up in selling these electric beauties? The average DOM for used EVs maintained a steady pace at around 61-62 days, notably lower than their ICE counterparts—a green light for dealers considering boosting their EV stock. Moreover, the average price in the used EV market hovered around the £26k mark, approximately £8k more than the average ICE vehicle—a factor worth considering when deciding on your next stock purchase.
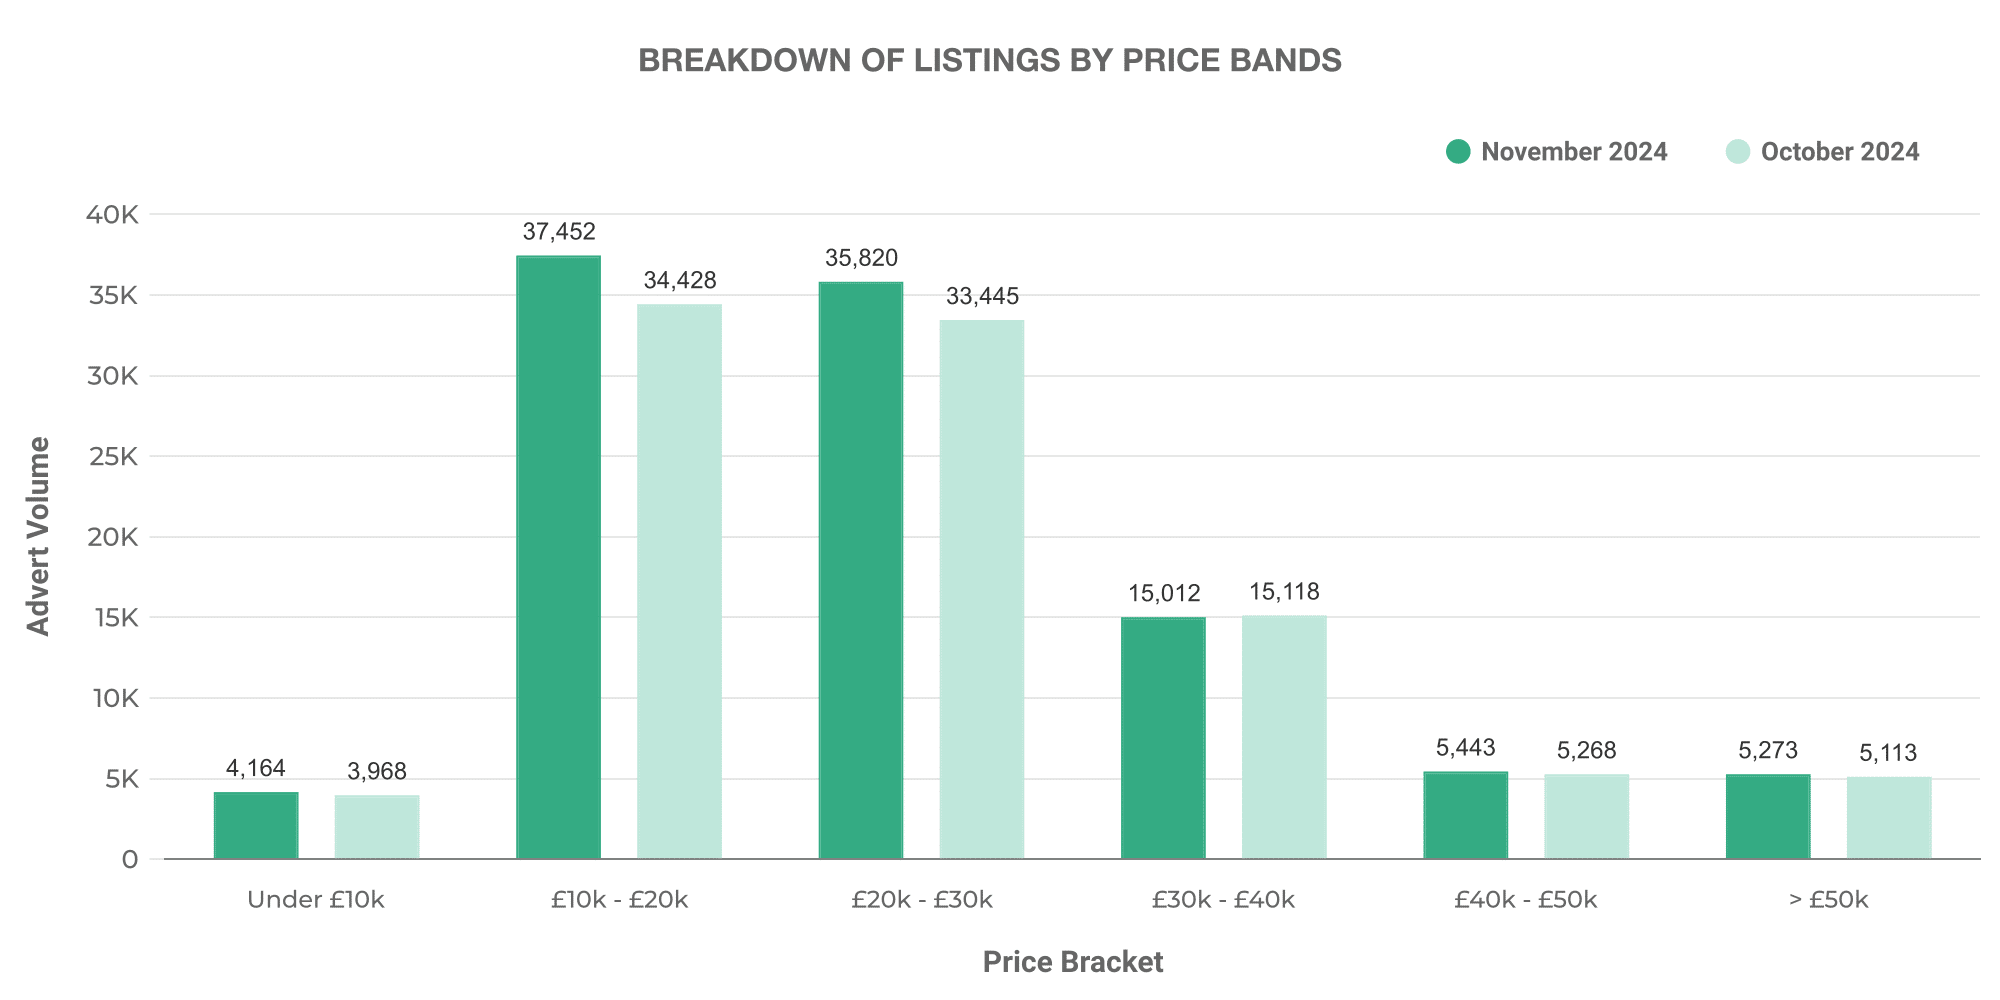
Shifting to EV price bands, the most prominent segment flourished between £10-20k, with 37,452 units selling in November, reminiscent of the sensational turn in the ICE market. Interestingly though, a significant number of EVs were also listed in the £20-30k band—an emerging trend to keep an eye on.
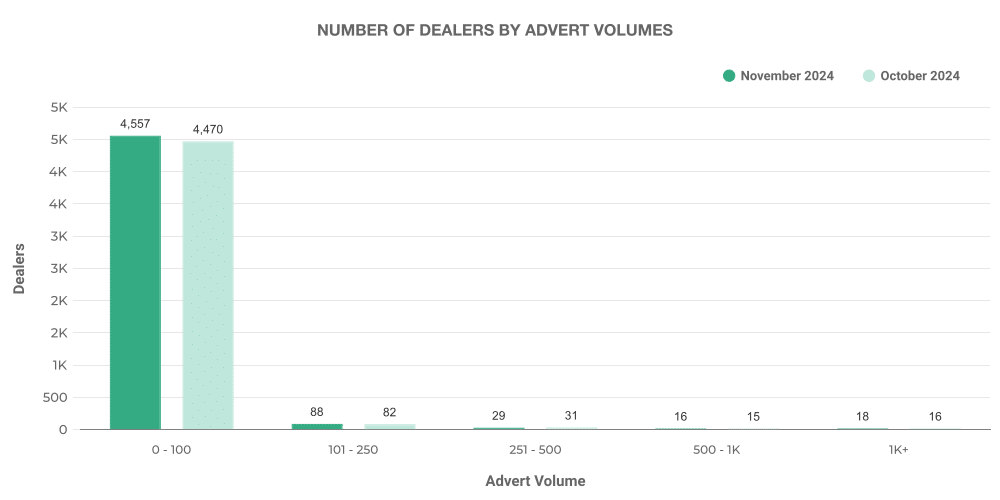
On turning to dealer advertising volumes in the EV sector, again, small-scale dealers claimed the pole position, making up the largest slice of the pie.
Charging Ahead: The Top 100 EV Dealers
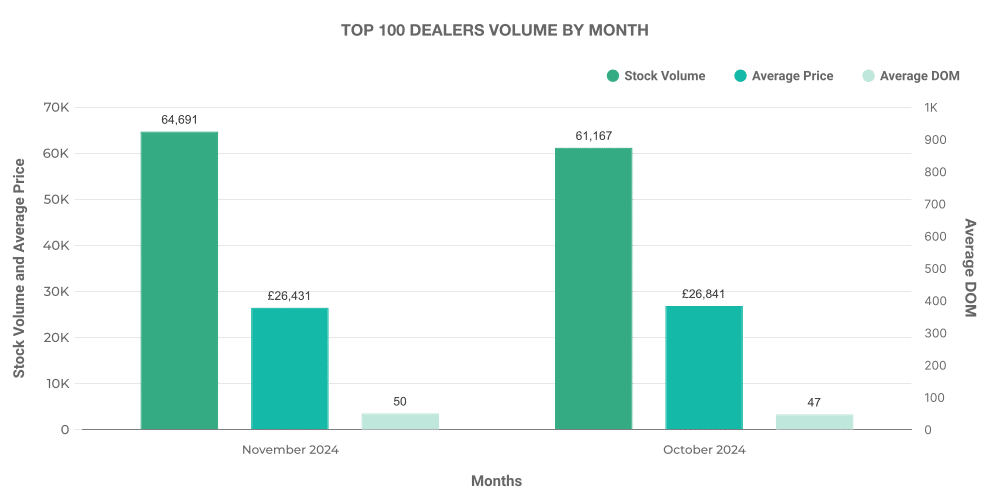
Just like in the ICE market, the top 100 dealers played a significant role in the used EV industry too. Stock for these leaders accelerated from 61,167 in October to 64,691 in November—a promising surge in volume. Interestingly, their average DOM crept up slightly from 47 to 50 days—still below the general EV market average, contributing to their stellar performance.
Previous week: 23rd November
