The UK used car market is seeing interesting shifts as both electric and internal combustion engine (ICE) vehicles continue to evolve. With ongoing fluctuations in car prices, the number of listings, and dealer volumes, understanding these changes provides key insights for businesses in the automotive sector. This report takes a closer look at the data from the week ending 11th January 2025, offering insights into the current state of the market, comparing electric and non-electric vehicle segments, and identifying key trends.
Breakdown of Listings and Price Bands (ICE Vehicles)
For the week ending 11th January 2025, the total number of used ICE vehicles listed was 604,873, offered by 10,475 dealers. The listings were predominantly in the £10,000–£20,000 price band, followed by a strong representation in the £20,000–£30,000 range. These two price bands together accounted for over half of the market, underscoring the demand for mid-range priced vehicles.
Price Distribution of ICE Listings:
- £0-£10K: 18,601 listings
- £10K-£20K: 174,627 listings
- £20K-£30K: 232,322 listings
- £30K-£40K: 109,908 listings
- £40K-£50K: 37,330 listings
- £50K+: 14,196 listings
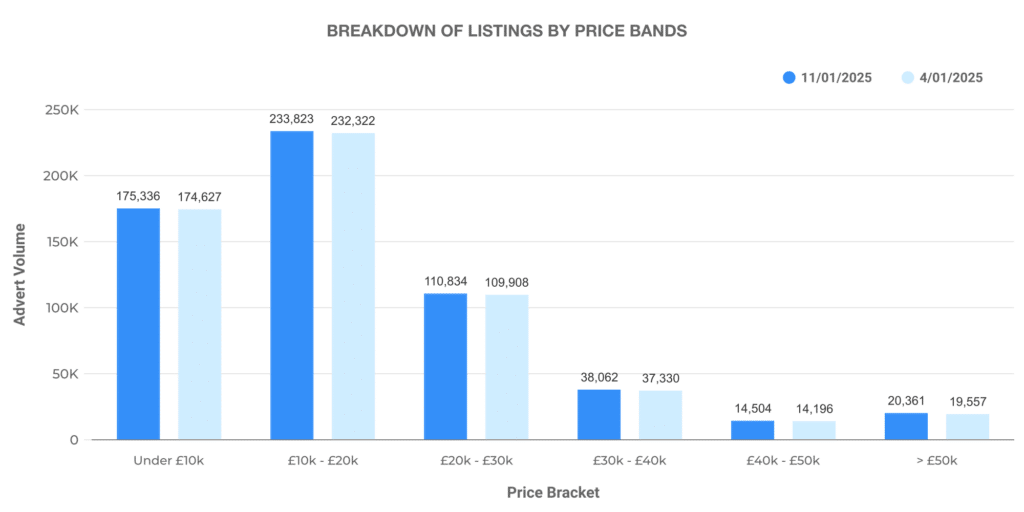
When looking at the volume of listings by dealer inventory size, most dealers (5,205) listed fewer than 100 cars, while a smaller proportion (541) had over 1,000 cars listed.
Breakdown of Listings and Price Bands (Electric Vehicles)
Turning to the electric vehicle market, the week saw 86,804 electric vehicles listed, with 4,447 dealers involved in the listings. Similar to ICE vehicles, the majority of the listings for electric cars were within the mid-range price bands, with significant numbers falling into the £20,000–£30,000 bracket.
Price Distribution of Electric Listings:
- £0-£10K: 3,053 listings
- £10K-£20K: 30,055 listings
- £20K-£30K: 28,414 listings
- £30K-£40K: 12,255 listings
- £40K-£50K: 4,517 listings
- £50K+: 4,895 listings
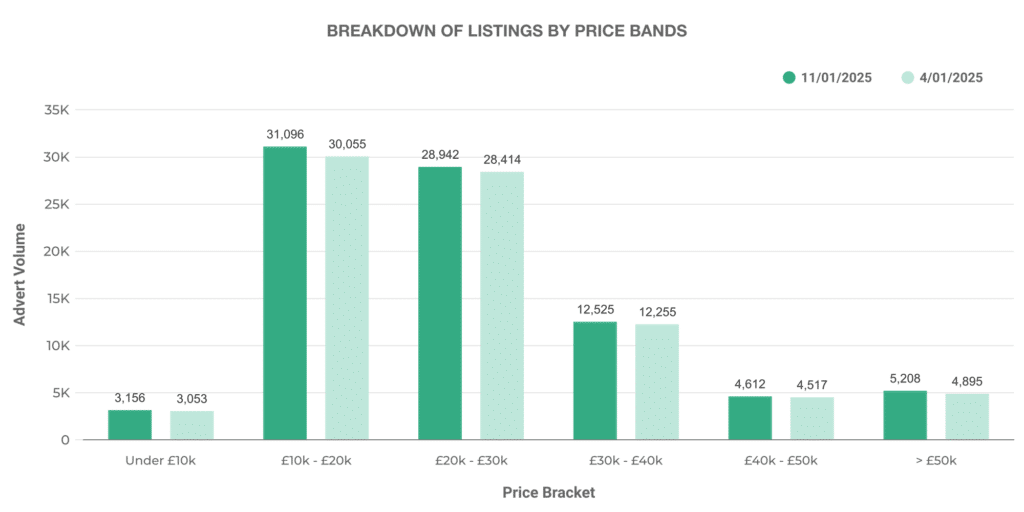
Electric vehicle listings represented 14.35% of the total market, an increase from the previous week’s 14.07%. The growth in listings shows continued interest and expansion in the electric vehicle segment.
Dealer Volume and Distribution (ICE vs EV)
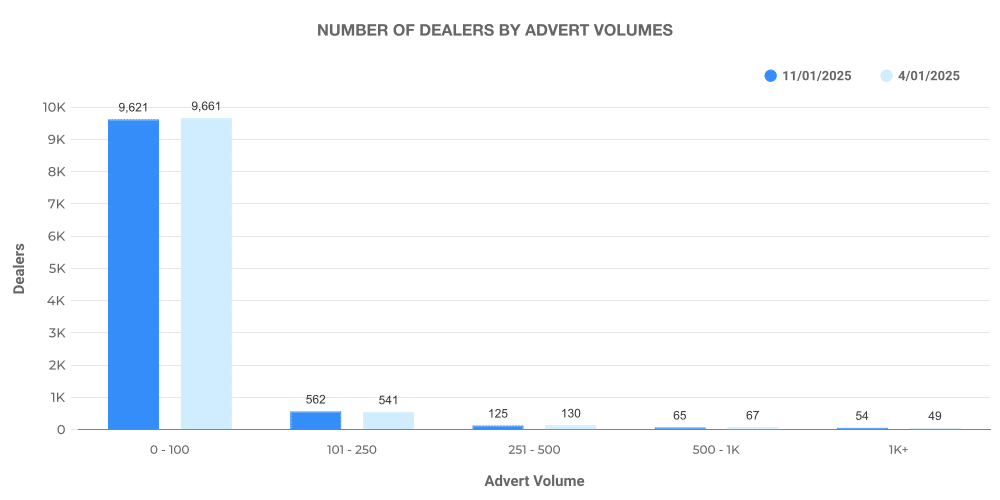
Both electric and ICE vehicles have been listed by a wide range of dealerships, but there are differences in the dealer volume distribution. For ICE vehicles, the majority of dealerships (5,205) listed fewer than 100 vehicles. The number of large dealers (those with 1,000+ vehicles listed) was smaller in comparison.
In contrast, for electric vehicles, most dealers (4,417) listed fewer than 100 vehicles, with a higher percentage of dealerships having listings in the 101–250 range.
ICE Dealer Volume:
- Dealers with 0-100 listings: 5,205
- Dealers with 101-250 listings: 1,562
- Dealers with 251-500 listings: 541
- Dealers with 500-1K listings: 130
- Dealers with 1K+ listings: 67
EV Dealer Volume:
- Dealers with 0-100 listings: 4,417
- Dealers with 101-250 listings: 1,603
- Dealers with 251-500 listings: 562
- Dealers with 500-1K listings: 125
- Dealers with 1K+ listings: 49
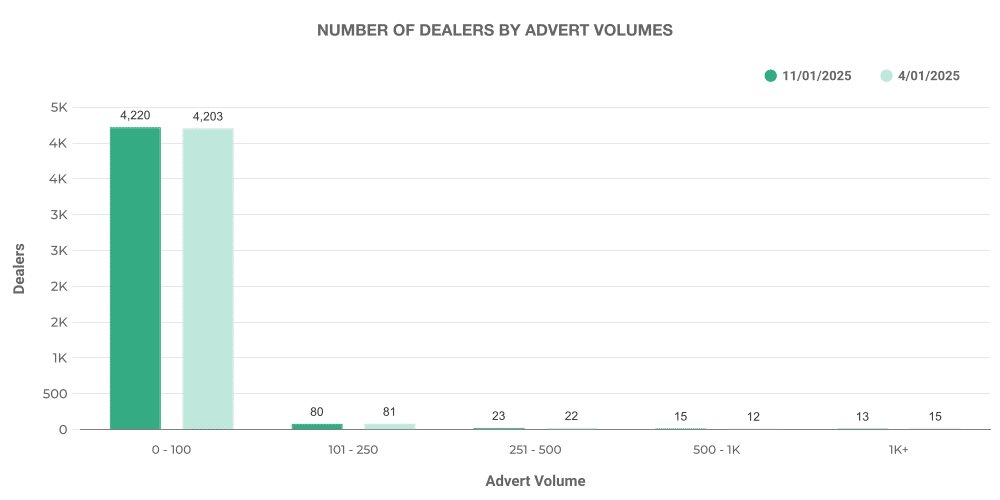
This difference highlights that electric vehicle listings are somewhat more concentrated among mid-sized dealers, while larger ICE vehicle dealers account for a significant proportion of the market.
Price Analysis: ICE vs EV
Average Price Comparison:
- Average price of ICE vehicles: £18,601
- Average price of electric vehicles: £26,745
The higher average price for electric vehicles reflects the increasing demand for newer, high-end electric models. Electric vehicles in the £20,000–£30,000 range accounted for a significant portion of listings, as more premium electric cars enter the used car market.
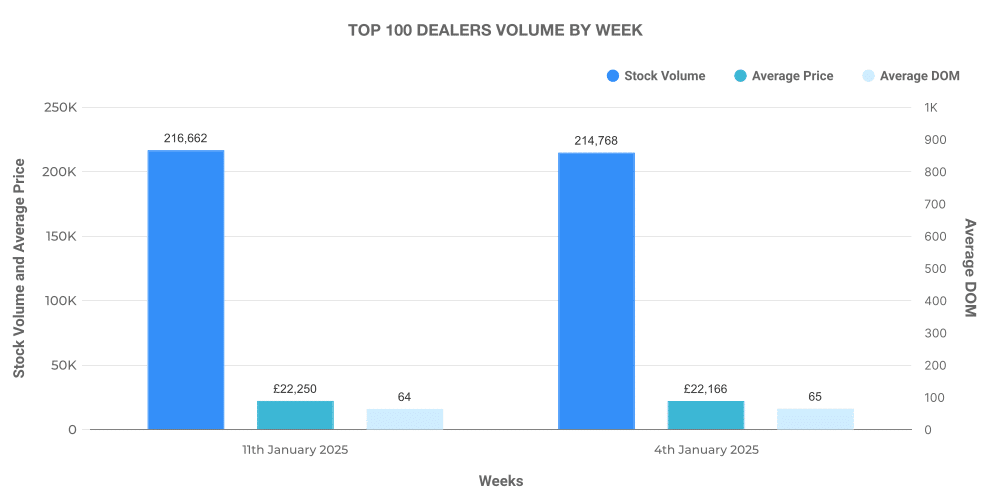
Top 100 Dealers: ICE vs EV The top 100 dealers by listing volume account for a larger percentage of ICE vehicle listings compared to electric vehicles.
- Top 100 ICE Dealers accounted for 18.7% of ICE listings, with an average price slightly above the market average at £19,444.
- Top 100 EV Dealers represented 14.5% of the total EV listings, with an average price of £27,358.
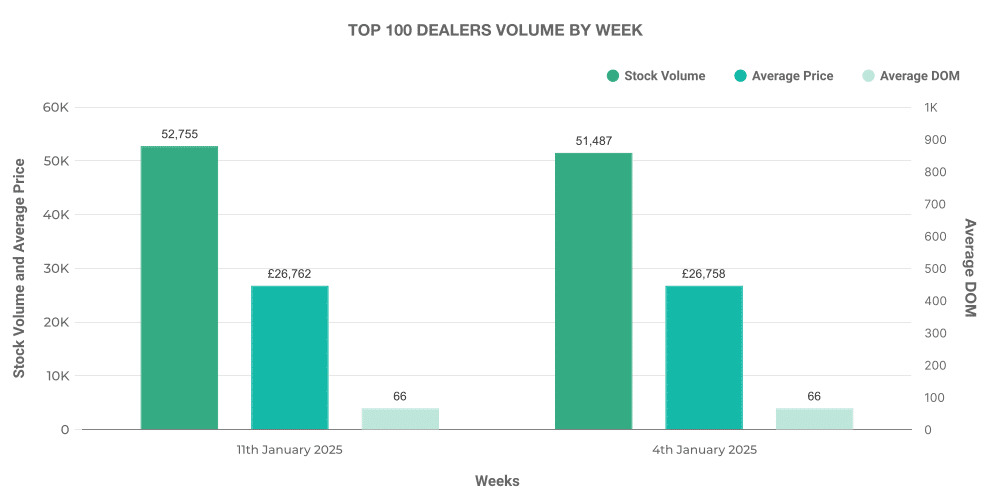
The premium pricing for EVs in the top 100 dealers’ stock may indicate a focus on higher-end, newer models compared to the broader market.
EV Market Share and Comparison to ICE
The electric vehicle market share continues to grow, reaching 14.35% of total used car listings for the week. Despite this growth, ICE vehicles still dominate the market, comprising 85.65% of total listings.
EV vs ICE Share:
- Electric Vehicles (EVs): 14.35%
- Internal Combustion Engine (ICE) Vehicles: 85.65%
The price disparity between EVs and ICE vehicles remains substantial, with electric vehicles carrying an average price of £26,745 compared to £18,601 for ICE vehicles. This highlights the continuing premium nature of the EV market, even in the used car sector.
Top 10 Electric Vehicles by Make and Model
The top 10 electric vehicle listings were dominated by models from Toyota, KIA, and Tesla, with the Toyota Yaris and KIA Niro taking the top spots in terms of listings. This reflects the growing consumer preference for established brands offering reliable electric options at accessible price points.
Top 10 EV Models by Listings:
- Toyota Yaris – 3,977 listings
- Toyota C-HR – 2,894 listings
- KIA Niro – 2,774 listings
- Toyota Corolla – 2,561 listings
- BMW 3 Series – 1,987 listings
- Ford Kuga – 1,919 listings
- Tesla Model 3 – 1,907 listings
- Hyundai Kona – 1,712 listings
- Hyundai Tucson – 1,547 listings
- Toyota RAV4 – 1,545 listings
These figures underline the ongoing success of mainstream manufacturers in the electric vehicle sector, suggesting that more consumers are opting for established brands as they transition to electric driving.
Next week: 18th January | Previous week: 4th January
