UK Weekly Used Car Market Data – March 2029
Understanding the transformations in the used car market, specifically focusing on both internal combustion engines (ICE) and the electric used car market, is critical to UK car dealers, insurance companies, investment companies, and car finance lenders and brokers. Being alert about these trends can assist in formulating strategies and devising plans for growth. This analysis will focus on the data centred around the used car market in the UK, placing particular emphasis on automotive market insights and the UK car price trends.
ICE Vehicles: Overview of the Market
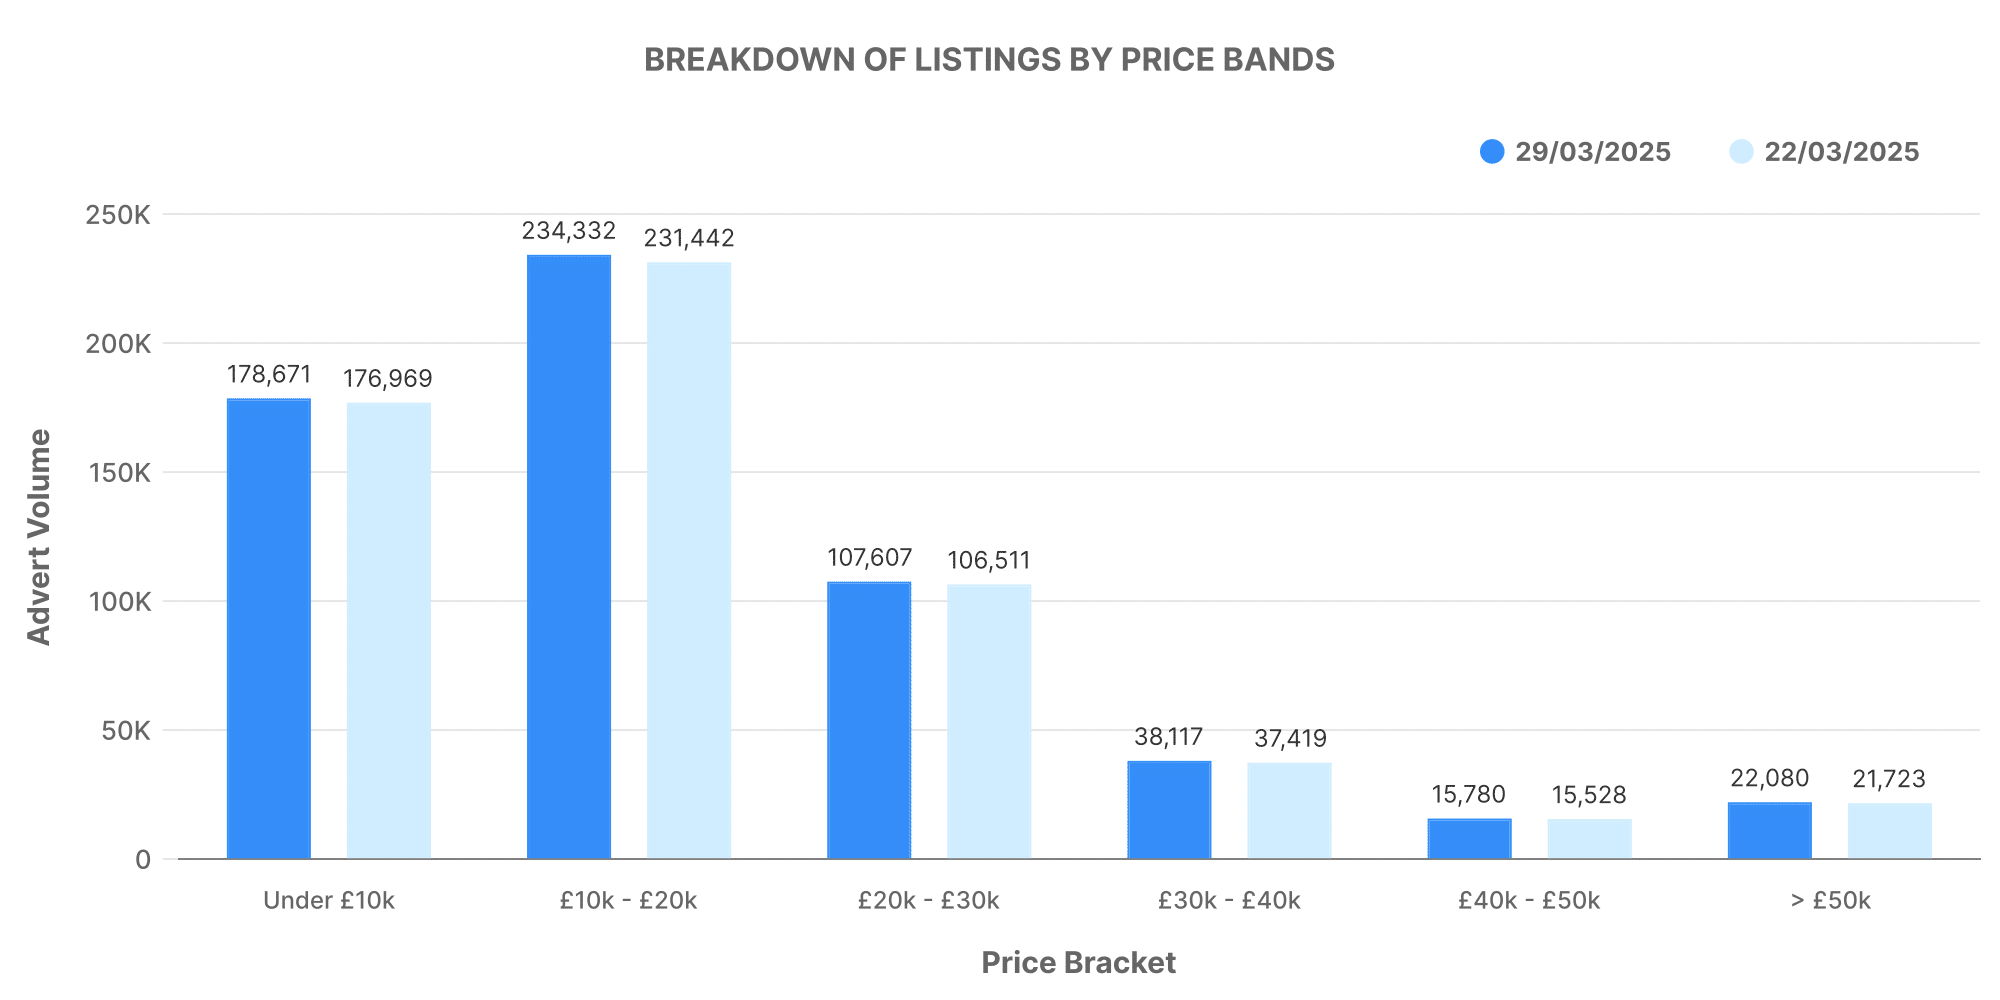
In the UK for the week ending 29th March 2029, we observed a total of 607,960 used ICE cars listed by 10,576 dealers. Looking at the price bands for these listings, most of the cars fell within the £10,000 – £20,000 range, with an average listed price of approximately £18,844.
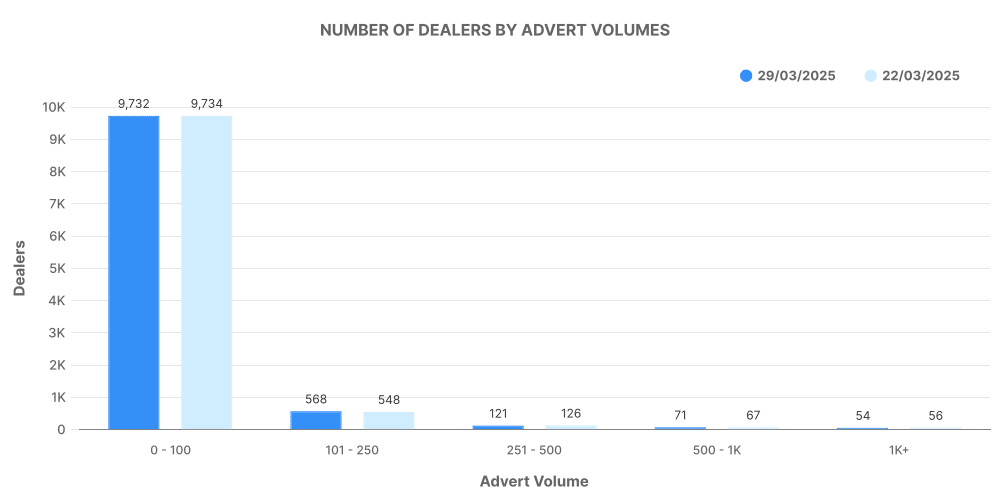
The dealer volumes provide more context—the majority of dealers listed between 101-250 vehicles, exhibiting the established nature of this market.
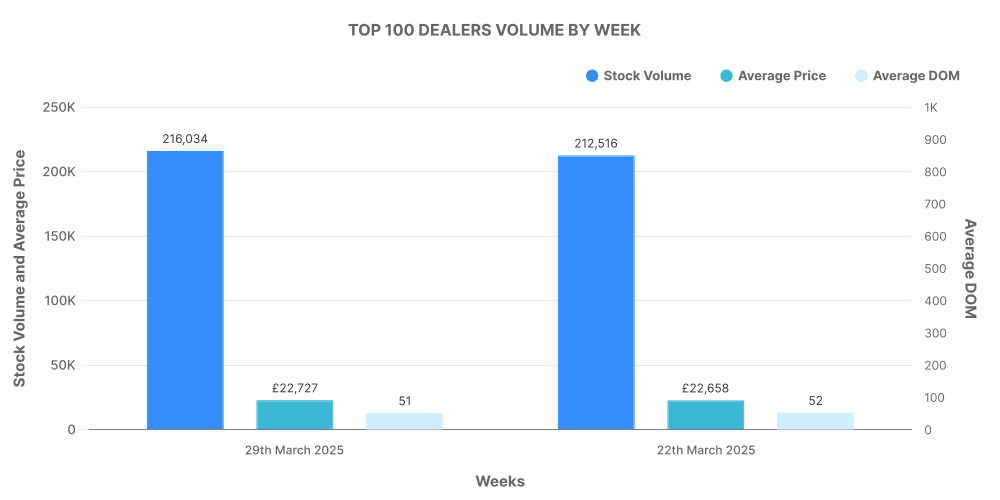
An analysis of the top 100 dealerships by listing volume gives us the following: The top 100 dealers accounted for 35.5% of total listings, selling vehicles at an average price slightly higher than the overall market average.
Electric Used Car Market: An Inside Look
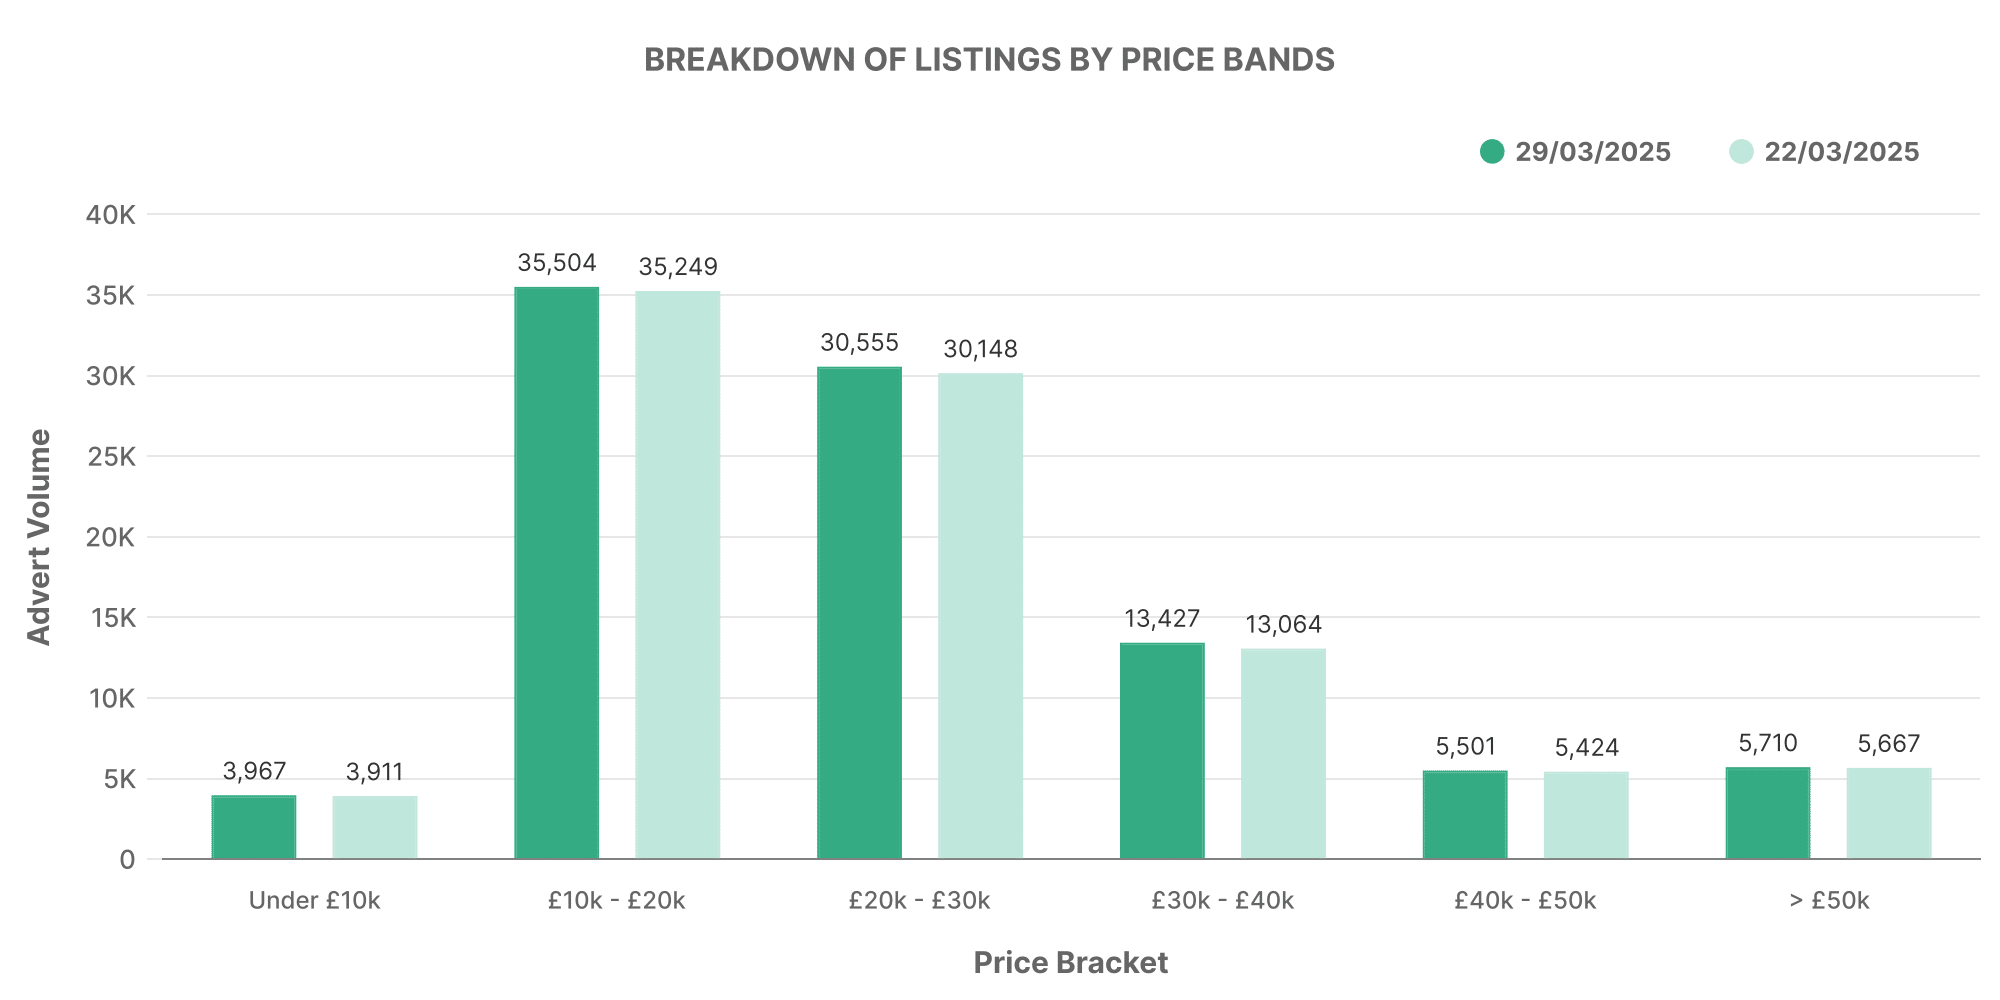
In contrast, the electric used car market witnessed a total of 95,840 used electric vehicles (EVs) listed by 4,662 dealers for the same duration. Looking at the EV listings by price bands, a significant majority of listed EVs are priced between £10,000 – £20,000. Notably, the average price of listed EVs (~£26,590) was considerably higher compared to ICE cars (~£18,844).
Regarding the dealer volumes, the majority of dealers listed between 0-100 vehicles, indicating the relative novelty of this market compared to ICE.
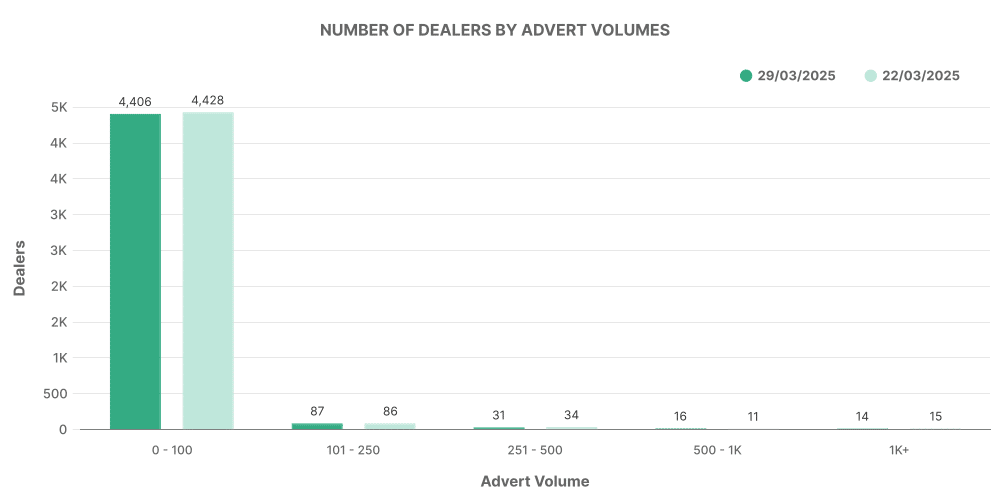
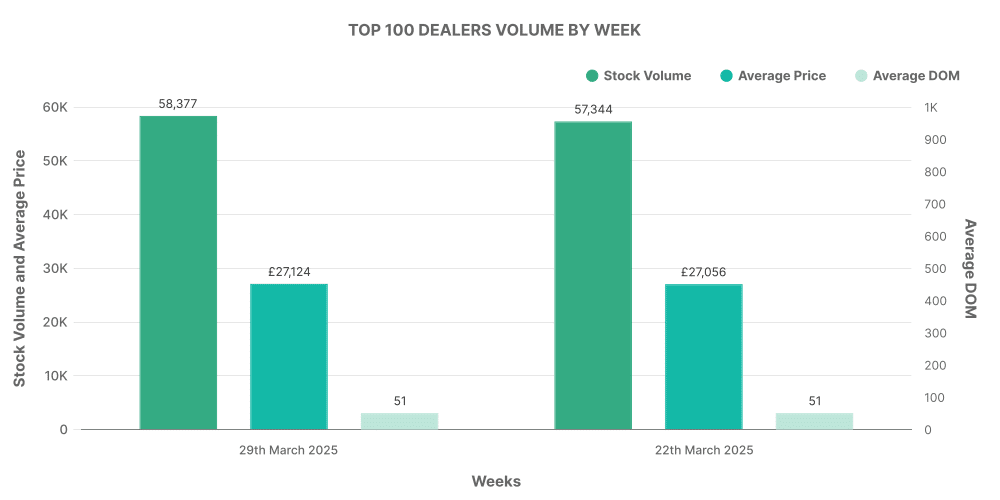
Looking at the top 100 dealerships in the EV market, they accounted for 60.95% of total EV listings, selling EV vehicles with an above-average market price.
ICE vs EV: An Analytical Comparison
Referring to the data, the ICE market remains more significant in volume but shows lower average pricing compared to the emerging EV market. The EV market, although smaller in number, shows a higher average price. This data might suggest that the EV market is positioned more towards the premium segment in the current scenario, but it also may be due to the higher initial cost of EVs.
These insights into the used car market, significant UK car price trends, and deep automotive market insights can help businesses in the automotive sector shape their strategies and business goals. For further detailed analysis and data, contact Marketcheck UK.
Previous week: 22nd March
