Navigating the tumultuous waters of the used car market often necessitates sophisticated data, timely analysis, and in-depth insight. Therefore, understanding trends, patterning, and shifts in the automotive industry can contribute significantly to adopting effective strategies and planning for profitable growth. This analysis piece will focus specifically on the UK’s used car market, laying emphasis on combustible engine vehicles (ICE) and delving into the intricacies of the rapidly evolving electric used car market (EV).
Shifting Gears in the Market: From ICE to EV
The used car market in the UK is presently witnessing a wave of changes. EVs, once considered an expensive novelty, are currently marking a significant shift in buying patterns. On the other end of the spectrum, conventional internal combustion engine vehicles (ICE), are struggling to maintain their dominant position.
As we approach the end of June, let’s highlight the key figures defining the week ending 21st June 2025.
For this period, we noticed a total of 604,402 ICE used cars, listed by 10,616 dealers across the UK. Meanwhile, in the EV sector, 95,053 used cars were listed by 4,758 dealers. In an interesting twist, the average price of an ICE-car peaked at £18,709, while EVs outpaced that figure with an average price of £26,286.
The Tale of Two Markets: Comparison Between ICE vs EV
Now, let’s unravel the data around the trends, pricing, and top dealers in the ICE and EV sectors.
ICE Used Car Market
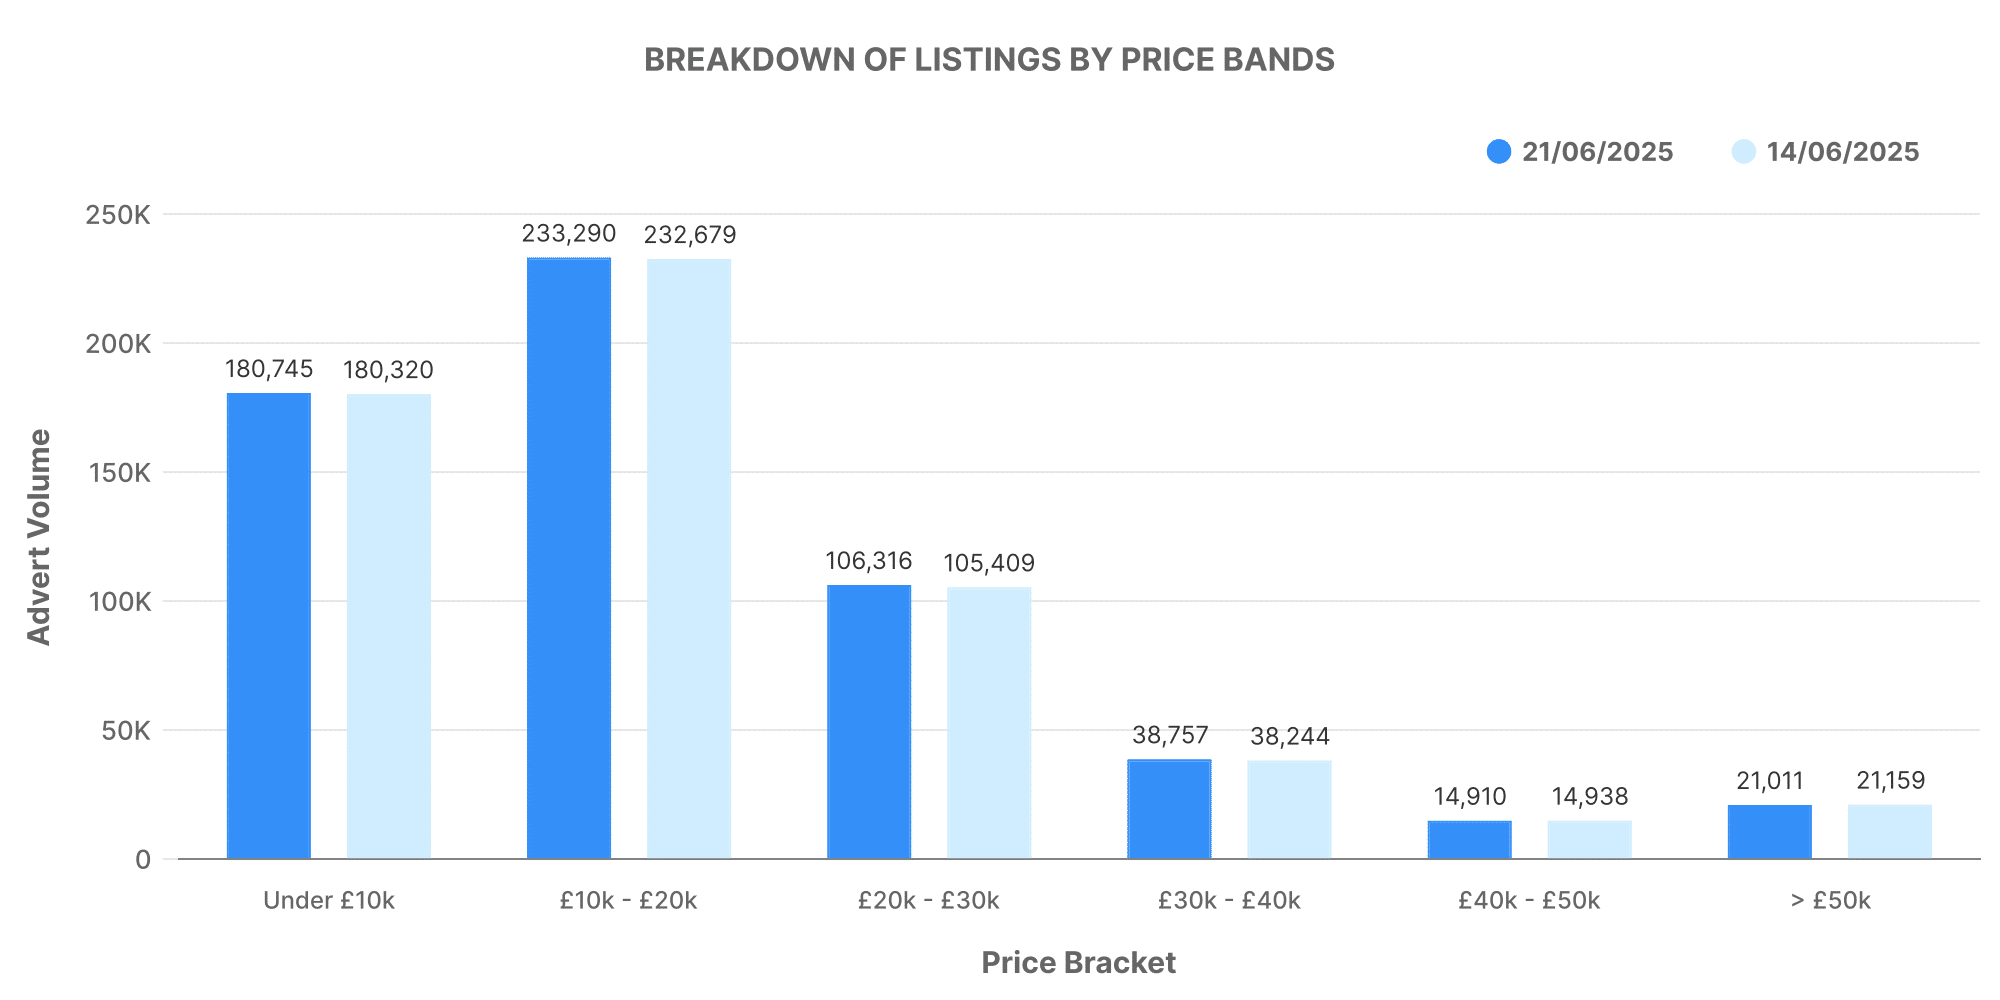
In the ICE used car market, most listed cars are priced within the £10,000 – £20,000 range, closely followed by the £20,000 – £30,000 bracket.
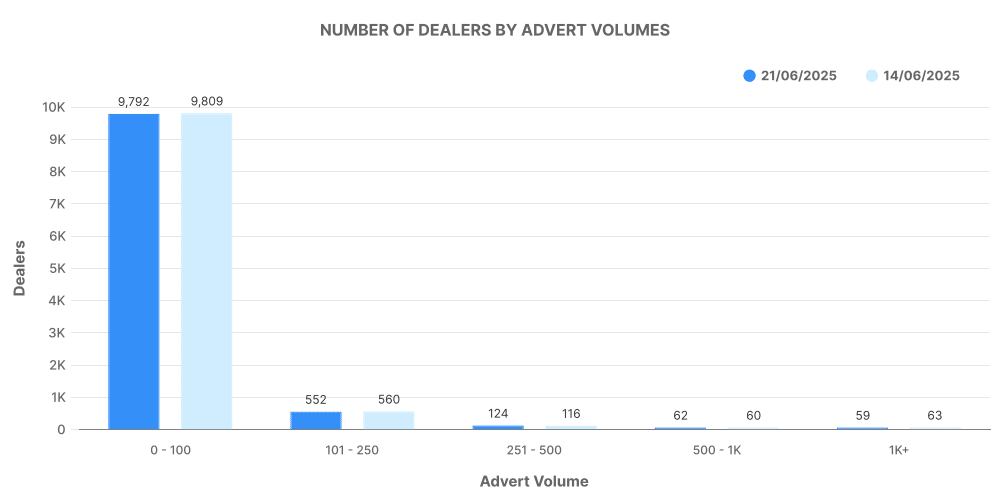
In terms of dealer volume, most sell between 0 and 100 vehicles – indicating a balanced market trajectory.
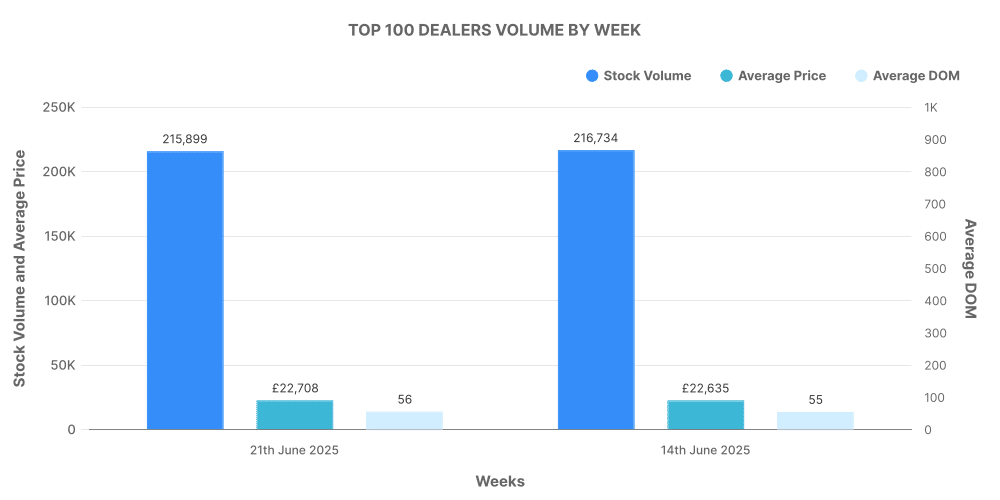
Among the top 100 ICE dealerships, there’s a notable contribution to overall vehicle listings, accounting for around 15.5% of the total.
Electric Used Car Market (EV)
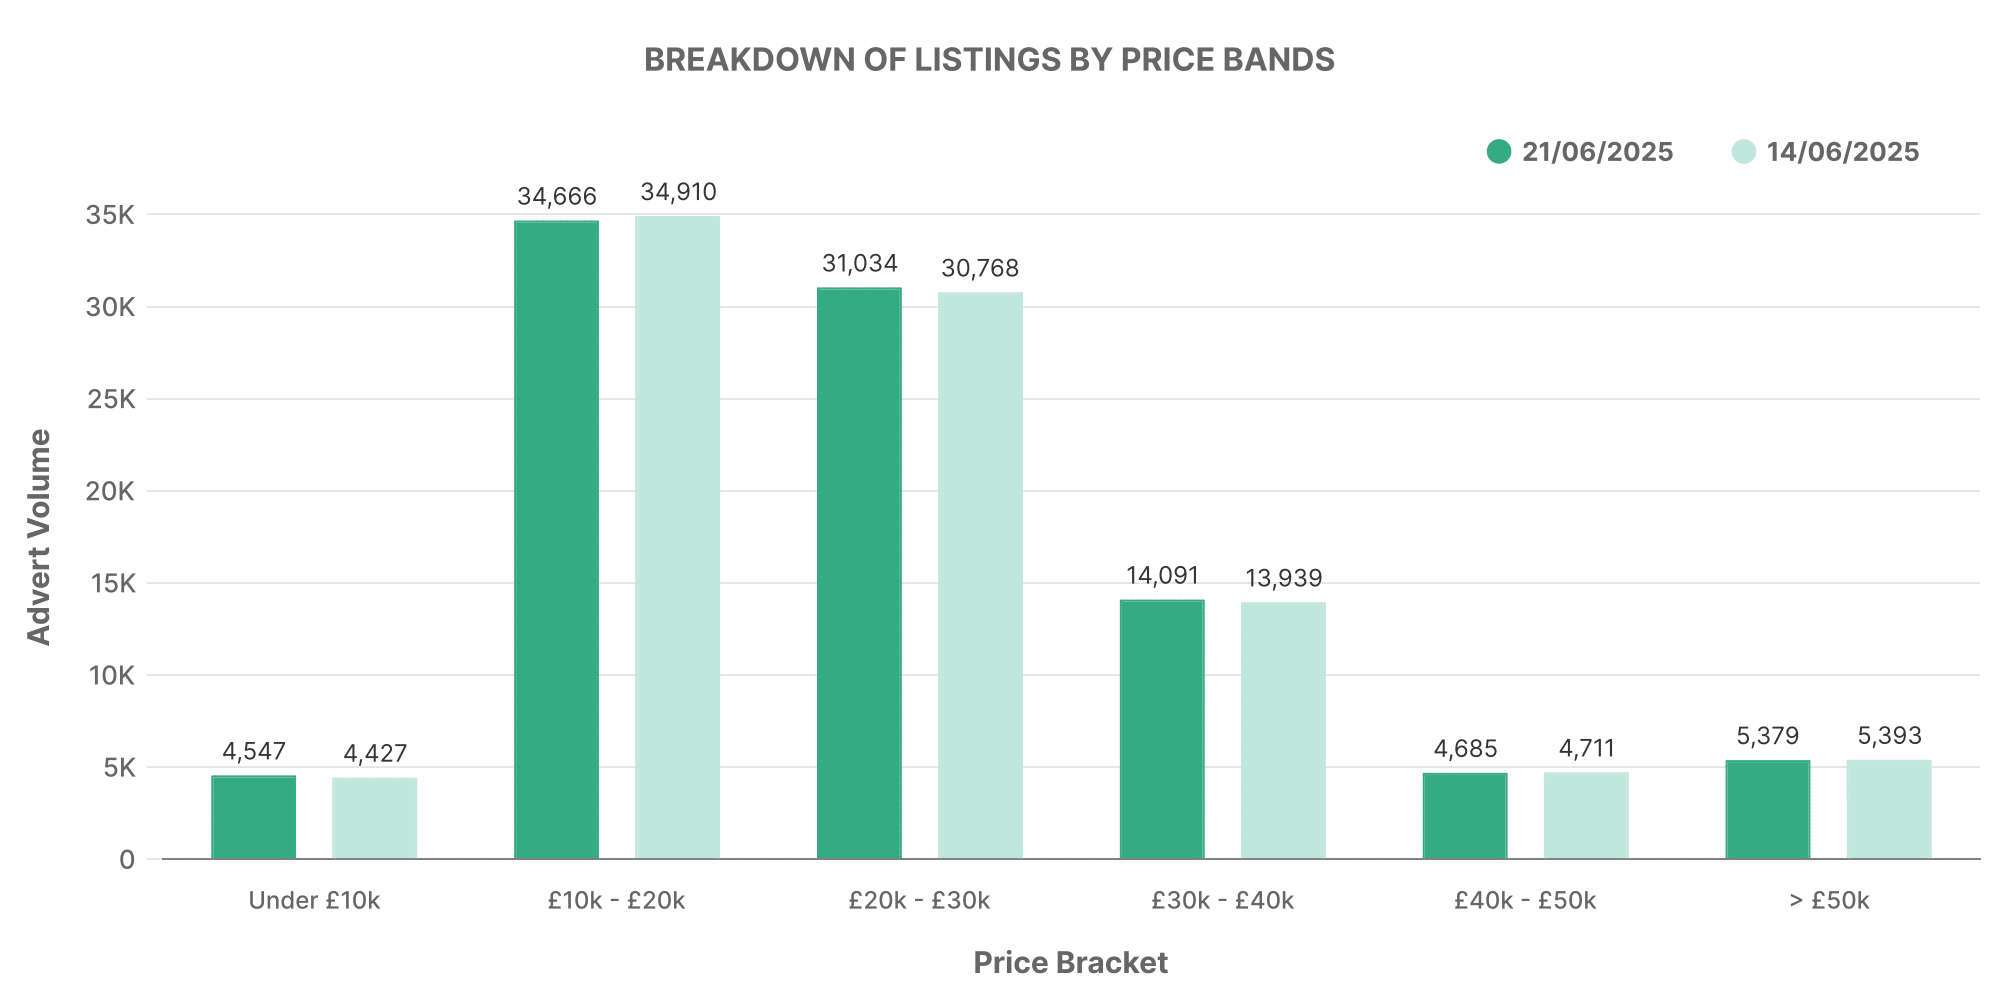
Conversely, in the electric used car market, most cars listed range within the £10,000 – £20,000 bracket, again followed by a sizeable number in the £20,000 – £30,000 range.
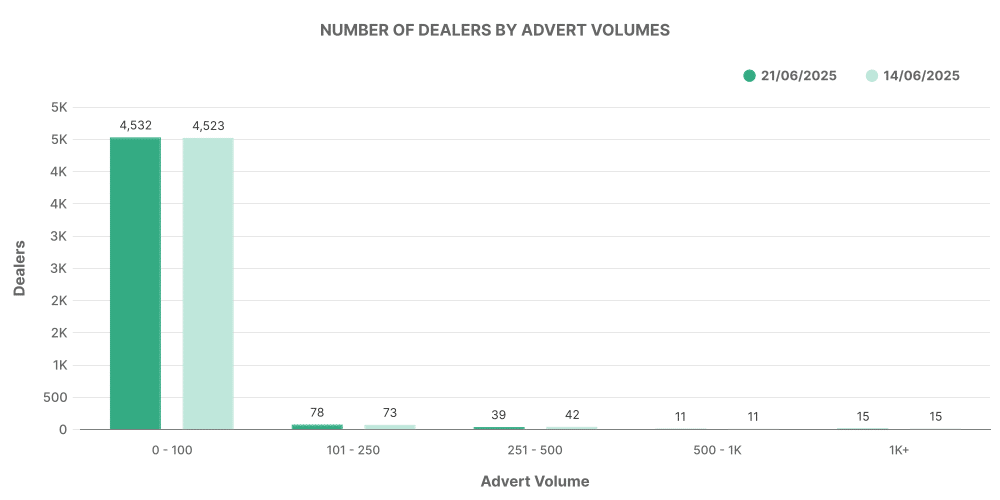
Interestingly, the majority of EV dealers listed between 0-100 vehicles, which could highlight the relative novelty in this market sector.
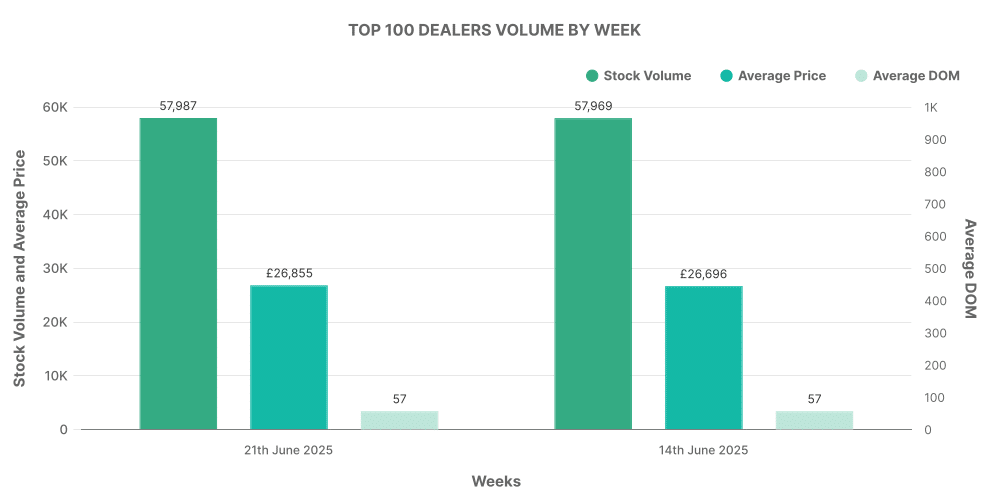
Finally, the top 100 EV dealers accounted for 18.7% of total listings, contributing significantly to the overall market.
Wheels in Motion: Favourite Cars of the Week
After examining market trends and dealer data, let’s shift gears and check out the favorite cars of the week within the electric used car market. ‘Toyota Yaris’ came out on top with 5,130 listings, followed by ‘Toyota C-HR’ with 3,246 listings, ‘KIA Niro’ with 3,188 vehicles, and ‘Toyota Corolla’, listed 2,450 times in the week ending 21st June 2025.
