Based on the week’s data starting on 12th July 2025 and ending on 19th July 2025, crucial insights can be obtained about the used car market.
Numbering 10,588, the total dealers contributed to a total of 605,215 listings, an essential pool for automotive market insights. These were distributed across 14,541 rooftops, the physical locations where cars are sold.
Taking a glance at the average price of the used cars, it hinged around £18,775, indicating market stability and uniformity for this particular period.
Price Band Analysis
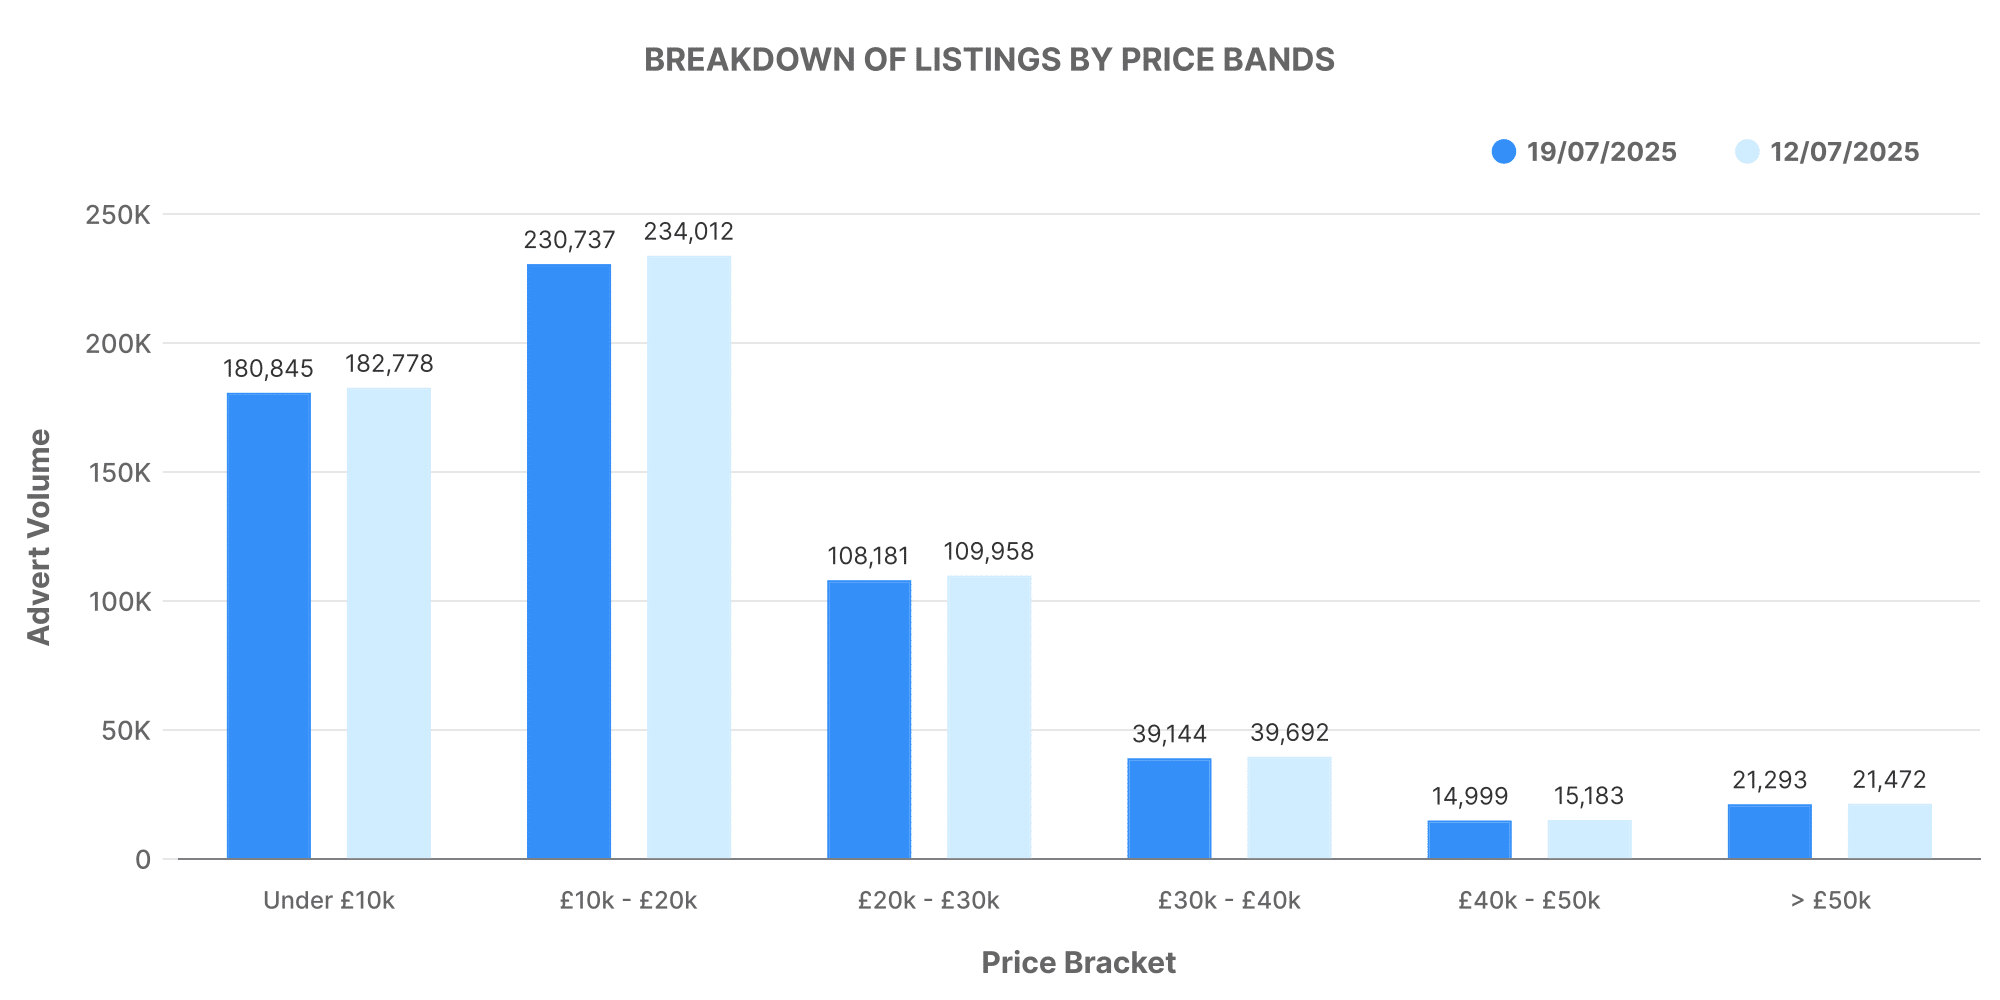
This graph provides a comprehensive breakdown of the used car listings by price bands. Most listings were within the £10,000 – £20,000 range. This was followed by cars in the £20,000 – £30,000 bracket. The graph indicates some stability in the market with little fluctuation for this period.
Dealer and Inventory Volume Analysis
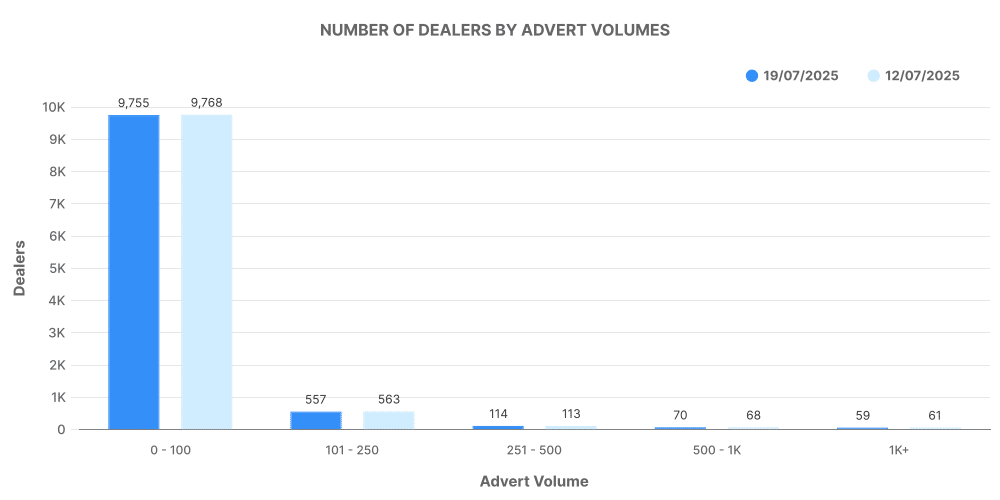
This graph showcases the distribution of listings among dealers, giving a more nuanced look into dealership volumes. Majority of the dealers listed cars numbering between 0-100.
Analysis of Top 100 Dealers
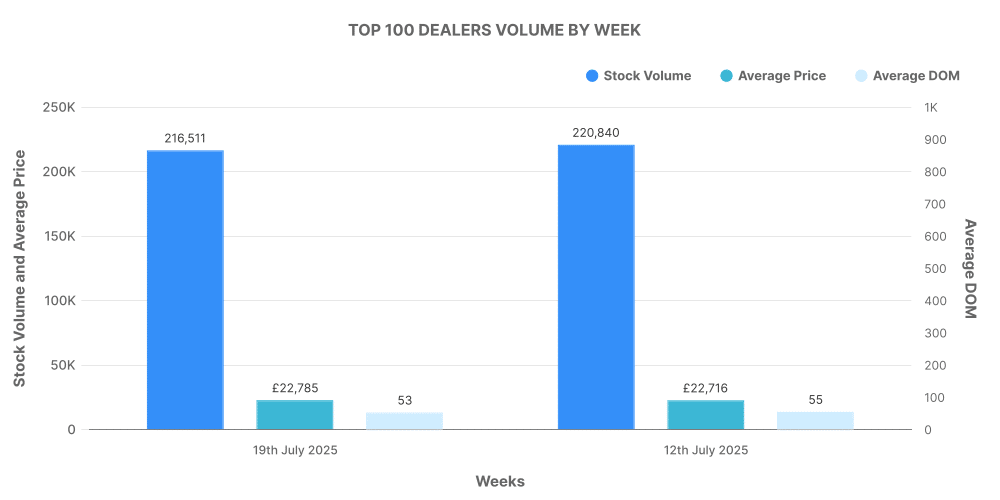
The top 100 dealers accounted for a sizeable portion of total listings — selling vehicles at a slightly more elevated price compared to the market average.
Electric Used Car Market Overview
The electric car segment, contributing significantly to the used car market in the UK, remains a crucial area of interest. With an increase in electric car dealerships and listings, the market appears to be experiencing notable growth.
For the same week, there were 4806 dealerships contributing to 96,331 electric used car listings. The average price of these vehicles was around £26,418, higher than their combustion counterparts.
Price Band Analysis
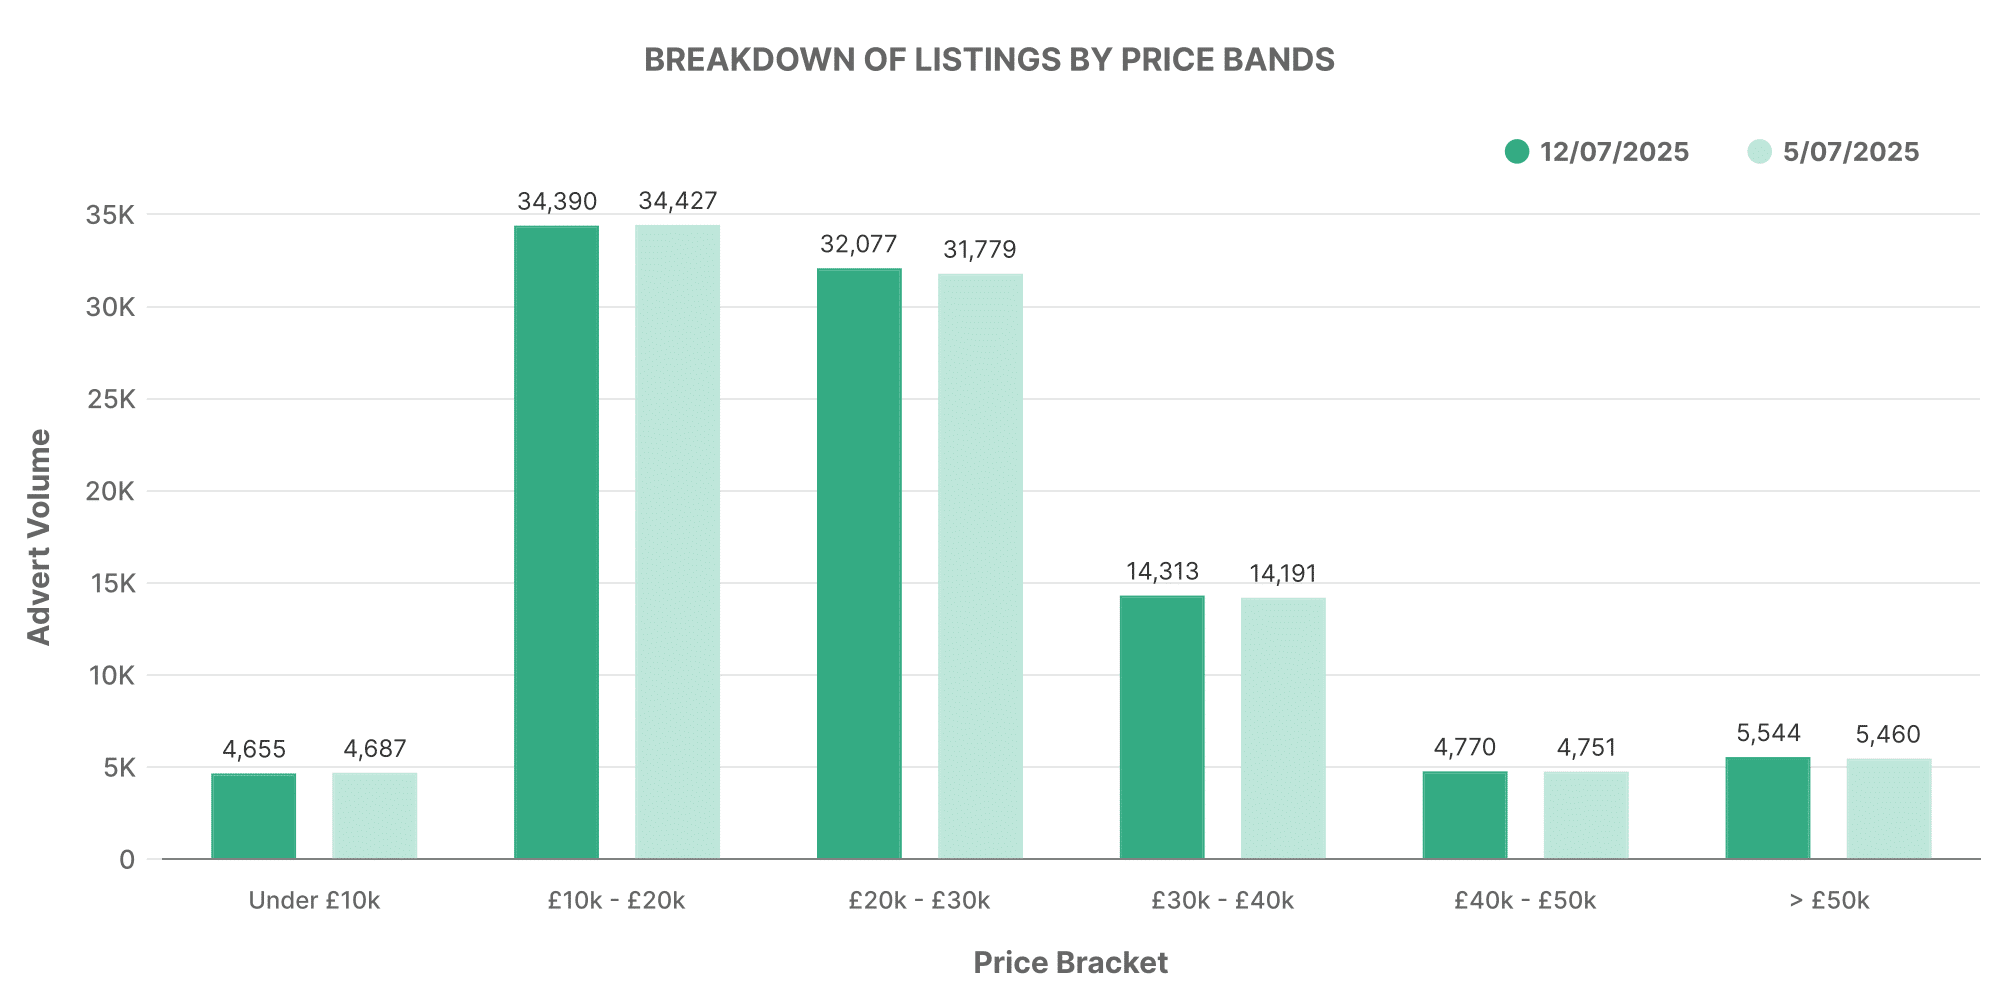
The electric used car listings showed a majority of listings within the £10,000 – £20,000 price band, mirrored by the general used car market. Next in line were listings in the £20,000 – £30,000 range.
Dealer and Inventory Volume Analysis
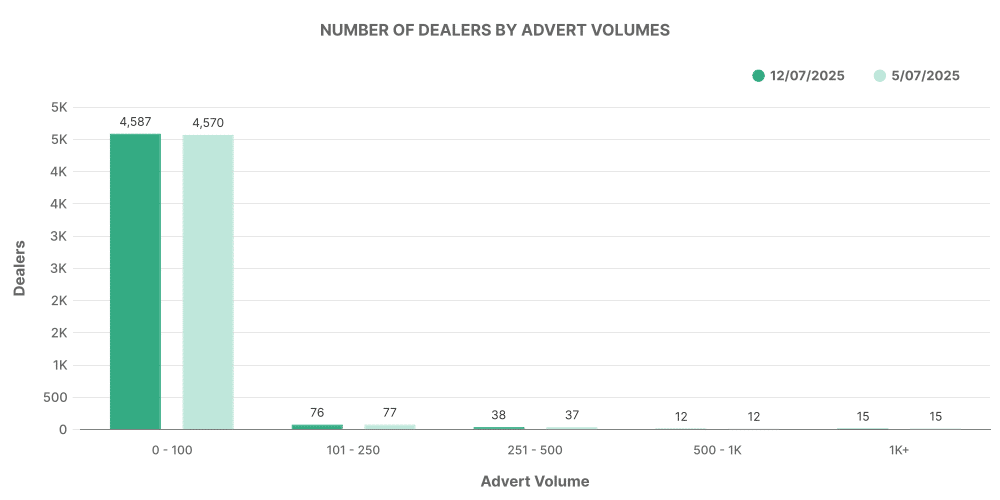
For EVs, the number of dealer listings followed a similar pattern to the overall used car market. However, the number of listings was significantly less, despite a growth in the market.
Analysis of Top 100 Electric Car Dealers
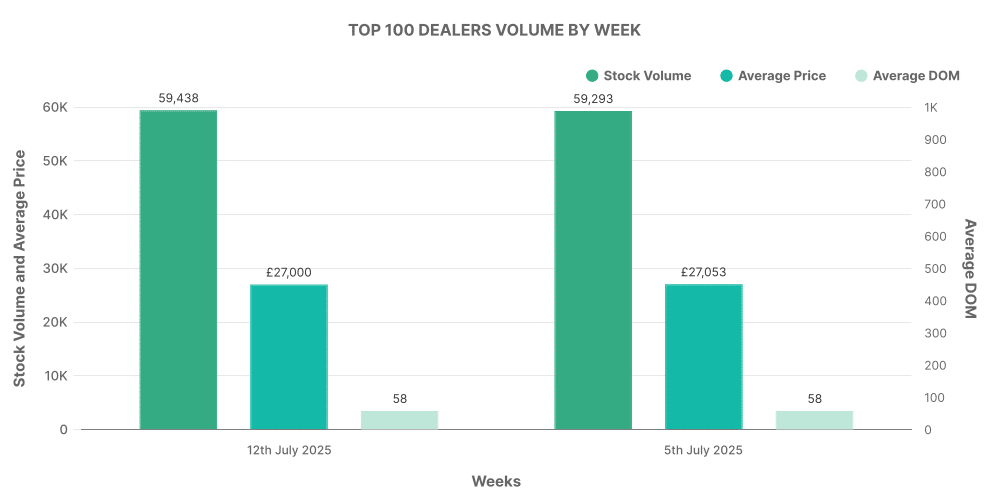
Similar to the traditional used car market, the top 100 dealers in the EV market contribute a sizable portion to the total listings. The average price of their vehicles were slightly above the market average.
Comparison: ICE vs EV
The UK used car market showed somewhat similar patterns within both the traditional and electric segment, clearly seen in the price band analysis, dealer and inventory volume distribution and top dealers’ performance.
However, looking closely into the average prices, the electric used cars are priced slightly higher, reflecting the growing popularity and adoption of eco-friendly vehicles in the UK and the current economic factors revolving around them.
