March’s used car market data highlights ongoing shifts across both traditional internal combustion engine (ICE) vehicles and the electric used car market. Listing volumes are rising across both categories, with modest changes in average prices. Dealers and investors will find the latest insights valuable for understanding consumer price sensitivity, stock volume patterns, and where the market is headed next.
Total Listings and Dealer Activity
In March 2025, the UK used car market recorded 851,280 ICE listings across 10,748 dealers, marking a 14.6% increase in listings compared to February. EV listings also grew, rising to 131,559 from 111,890 the previous month – a 17.6% increase. The number of dealers offering EVs rose slightly from 4,798 to 5,081.
The ICE market continues to hold the lion’s share of total listings. But EVs are slowly increasing their market share – now at 15.45%, up from 15.06% in February.
UK Car Price Trends – ICE Vehicles
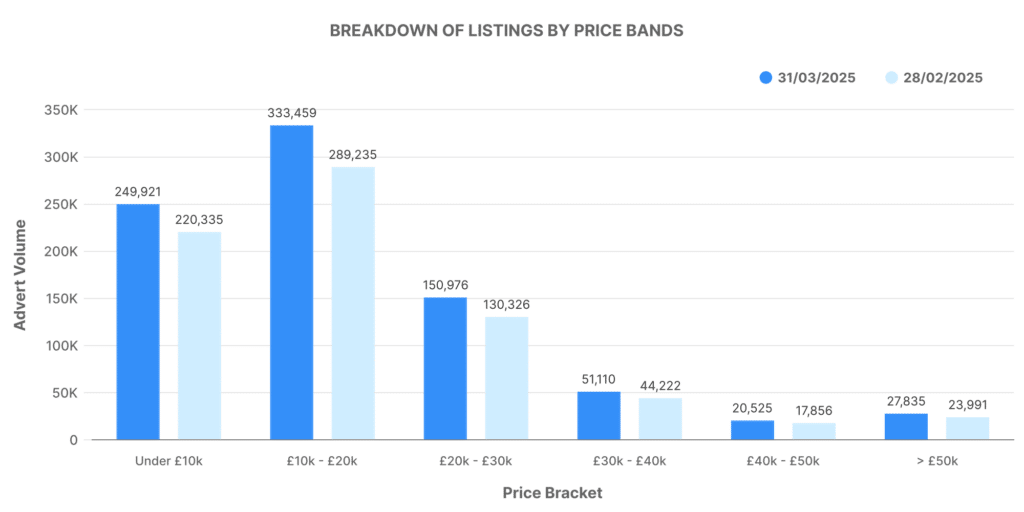
The average asking price for ICE vehicles in March stood at £18,439, nearly unchanged from February’s £18,399. The volume of listings by price band gives a clearer view of buyer behaviour:
- £0–10K: 249,921 vehicles
- £10K–20K: 333,459 vehicles
- £20K–30K: 150,976 vehicles
- £30K–40K: 51,110 vehicles
- £40K–50K: 20,525 vehicles
- £50K+: 27,835 vehicles
Most ICE listings continue to fall within the £10K–20K range, indicating that affordability remains key for combustion-engine buyers. The £0–10K bracket also grew, suggesting higher churn at the lower end of the market.
Breakdown of ICE Listings by Price Bands

This chart reflects the concentration of demand in the sub-£20K range. Over 68% of listings were priced under £20K, supporting the ongoing trend towards price-sensitive consumer behaviour. Listings priced between £30K and £50K formed just under 10% of the ICE market, showing the continued dominance of mass-market over premium models.
Electric Used Car Market – Average Prices and Trends
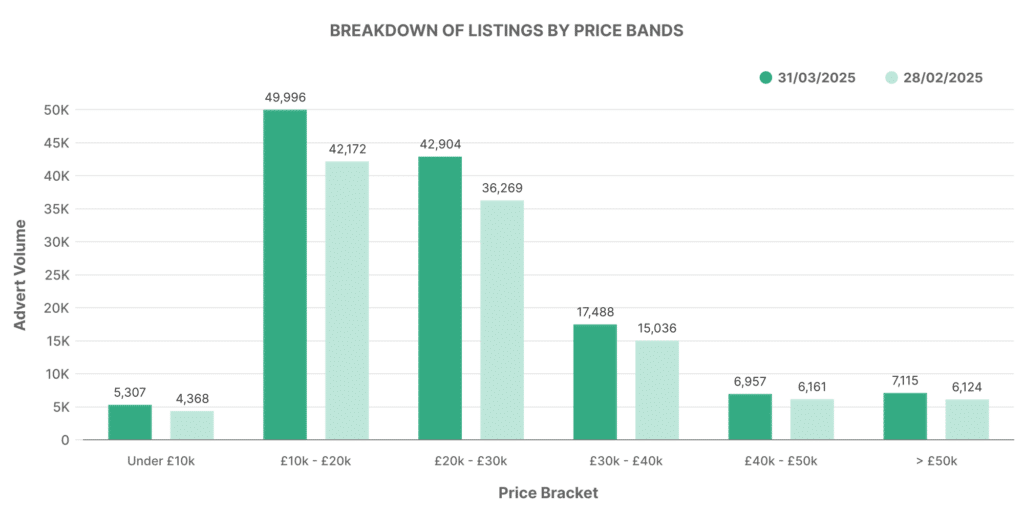
The average electric vehicle price in March was £26,037, holding steady from February’s £26,180. The EV price band distribution was as follows:
- £0–10K: 5,307 vehicles
- £10K–20K: 49,996 vehicles
- £20K–30K: 42,904 vehicles
- £30K–40K: 17,488 vehicles
- £40K–50K: 6,957 vehicles
- £50K+: 7,115 vehicles
The price spread suggests a maturing EV market, with nearly 40% of listings priced between £10K and £20K, and another 33% in the £20K–30K range.
Breakdown of EV Listings by Price Bands

Compared to ICE vehicles, the EV market shows a more balanced spread across mid-range price bands. The biggest growth sits in the £10K–30K range, where leasing returns and de-fleeting continue to feed a broad and accessible second-hand EV offering.
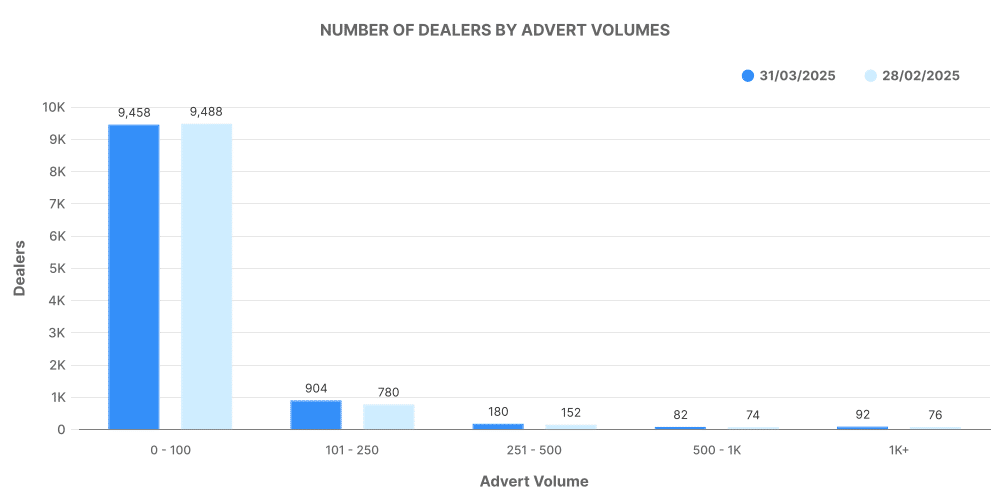
Dealer Inventory Volume – ICE
The distribution of ICE listings across dealers remains relatively consistent:
- 0–100 vehicles: 9,458 dealers
- 101–250 vehicles: 904 dealers
- 251–500 vehicles: 180 dealers
- 501–1,000 vehicles: 82 dealers
- 1,000+ vehicles: 92 dealers

The majority of dealers operate with lower inventory volumes, while a smaller group of high-volume retailers holds a sizeable share of stock.
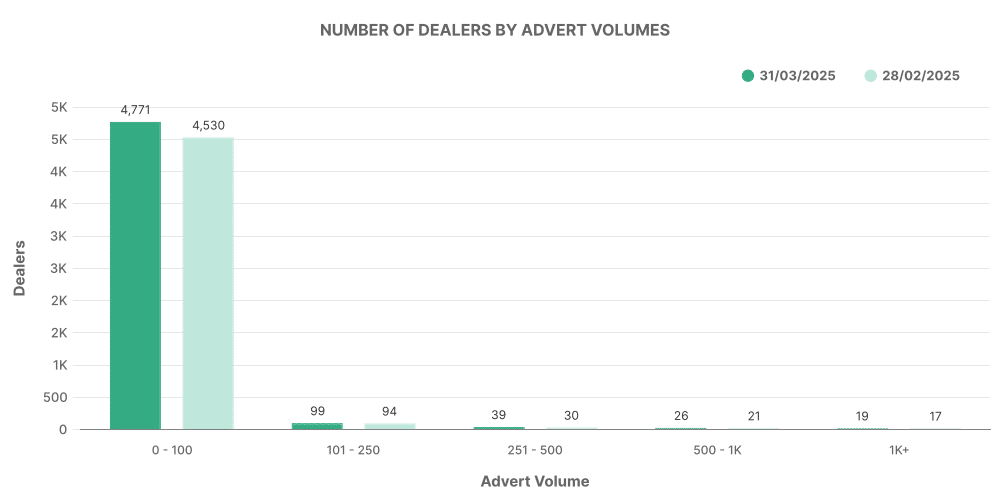
Dealer Inventory Volume – EV
The EV dealership inventory breakdown is more concentrated:
- 0–100 vehicles: 7,115 dealers
- 101–250 vehicles: 4,771 dealers
- 251–500 vehicles: 99 dealers
- 501–1,000 vehicles: 39 dealers
- 1,000+ vehicles: 26 dealers

While the ICE market is more evenly spread across dealer sizes, the electric used car market remains tightly clustered in the sub-250 inventory range. This suggests newer entrants or cautious stocking strategies around electric models.
Analysis of Top 100 Dealers – ICE
Top 100 ICE dealers accounted for 320,051 listings – roughly 37.6% of all ICE stock. They had:
- Average days on market: 47
- Average price: £22,053
- Price increases: 115,028
- Price decreases: 296,380
These dealers had higher stock turnover and higher prices than the overall ICE market, reflecting stronger brand equity, pricing power, and retail agility.
Analysis of Top 100 Dealers – EV
Top 100 EV dealers listed 82,184 vehicles – 62.5% of total EV listings. Their metrics show:
- Average days on market: 48
- Average price: £26,315
- Price increases: 26,966
- Price decreases: 95,014
The top EV dealers have slightly higher average prices than the EV market as a whole. Their influence on EV pricing and volumes is growing, as their stock makes up over 60% of the market.
Used Car Market Comparison – EV vs ICE
| Metric | ICE | EV |
|---|---|---|
| Total Listings | 851,280 | 131,559 |
| % of Overall Listings | 84.55% | 15.45% |
| Average Price | £18,439 | £26,037 |
| Average Days on Market | 75 | 60 |
| Dealers Participating | 10,748 | 5,081 |
| Listings Held by Top 100 Dealers | 320,051 | 82,184 |
EVs are now over 15% of the used car market – a sign of gradual adoption. They are priced higher and spend fewer days on market, suggesting strong consumer demand relative to supply. The ICE market remains broader in dealer participation and price points, but is slower moving overall.
Top 10 Advertised Used EVs by Volume – March 2025
Electric models continue to evolve in terms of popularity. These were the top advertised used EVs in March:
- Toyota Yaris – 6,363 listings
- KIA Niro – 4,788 listings
- Toyota C-HR – 4,342 listings
- Tesla Model 3 – 4,006 listings
- Toyota Corolla – 3,906 listings
- BMW 3 Series – 2,685 listings
- Hyundai Tucson – 2,680 listings
- Honda Jazz – 2,570 listings
- Ford Kuga – 2,552 listings
- Hyundai Kona – 2,449 listings
The presence of models like the Yaris, Niro, and C-HR near the top shows a healthy pipeline of compact electrified vehicles entering the second-hand market.
Key Takeaways for Stakeholders
This month’s data offers clear insights for UK-based:
- Car dealers looking to optimise pricing bands and stock turnover
- Car finance brokers targeting sub-£20K vehicles with short time-on-market cycles
- Insurance companies tracking EV uptake and pricing trends
- Investors monitoring EV market growth and dealer consolidation
- Auction businesses identifying which models attract high retail volumes
Marketcheck UK provides comprehensive data feeds and tools to support these stakeholders with accurate, real-time insights into the used car market. For access to full historical datasets or API integration, get in touch.
