Understanding movements within the UK used car market helps dealers, lenders, and investors align their strategies to real market behaviour. September 2025 presented steady market conditions across both internal combustion engine (ICE) and electric vehicles (EVs*), with pricing stability and consistent listing volumes from the country’s dealers.
This report reviews the UK used car market performance for September 2025, comparing ICE and electric used car segments and providing automotive market insights across pricing, dealer activity, and vehicle availability.
Overview of the used car market (ICE)
In September 2025, the used car market for internal combustion engine (ICE) vehicles recorded 796,539 active listings across 10,699 dealers and 15,859 rooftops. The average price of a listed ICE vehicle stood at £18,662, reflecting a steady market with moderate pricing stability compared with the prior month.
The average days on market (DOM) fell slightly to 74 days, hinting at continued healthy consumer demand and efficient stock turnover among used car retailers.
Breakdown of listings by price bands
Across all ICE vehicles, the distribution by price band demonstrates a clear skew towards mid-range affordability.
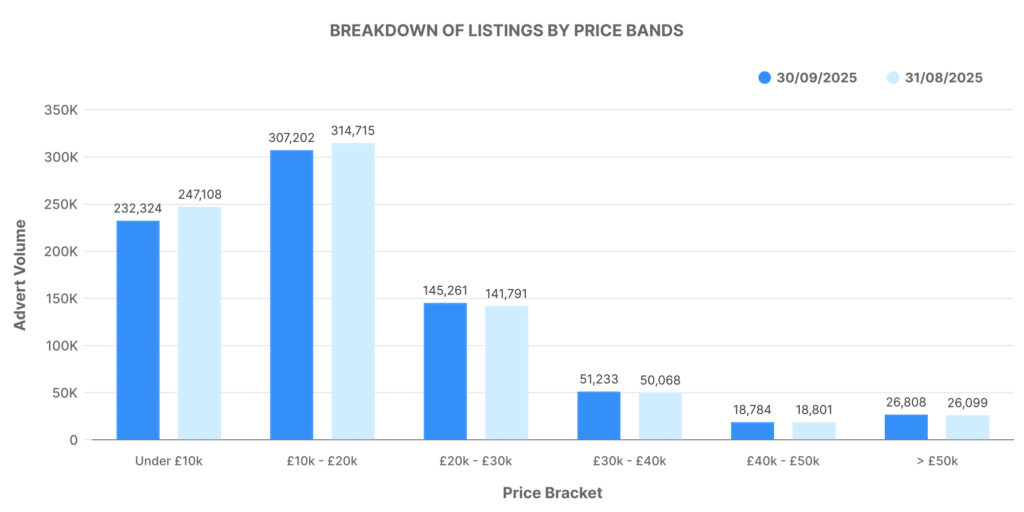
- £0–10K: 232,324 listings
- £10K–20K: 307,202 listings
- £20K–30K: 145,261 listings
- £30K–40K: 51,233 listings
- £40K–50K: 18,784 listings
- £50K+: 26,808 listings
The majority of vehicles continue to sit in the £10,000–£20,000 price range, accounting for nearly 39% of all listings. This remains the most active and competitive band for mainstream dealers. Higher-value listings above £40,000 represent less than 6% of all used cars advertised, showing that the bulk of transactions still revolve around accessible, mass-market stock.
The average price of £18,662 suggests that while premium and luxury listings remain steady, the mid-market continues to anchor most dealer activity and buyer interest.
Dealer activity and advert volumes
Dealer participation in the used car market remains broad and well-distributed:
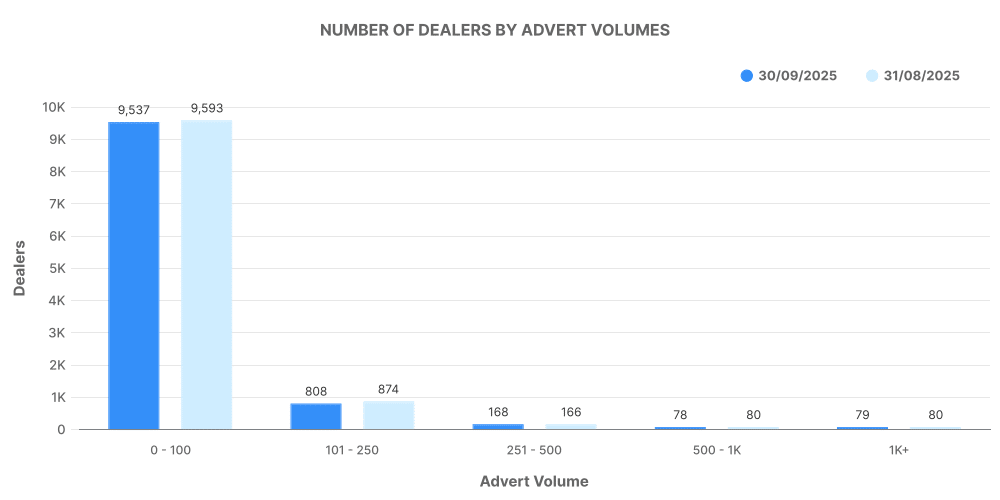
- 0–100 vehicles listed: 26,808 dealers
- 101–250: 9,537
- 251–500: 808
- 501–1,000: 168
- 1,000+: 78
The majority of ICE dealers listed fewer than 100 vehicles, reflecting the typical structure of the UK retail market, where smaller independent and franchised retailers contribute significantly to national listings.
The top 100 dealers collectively accounted for 308,722 listings, representing roughly 39% of total ICE stock. This cohort’s average price was £22,379, which sits notably above the national market average, showing that larger groups are still more focused on late-plate, higher-value stock. Their average DOM fell to 46 days, indicating faster retail cycles and stronger sales efficiency compared with smaller operators.
Top 100 dealers compared to the wider market
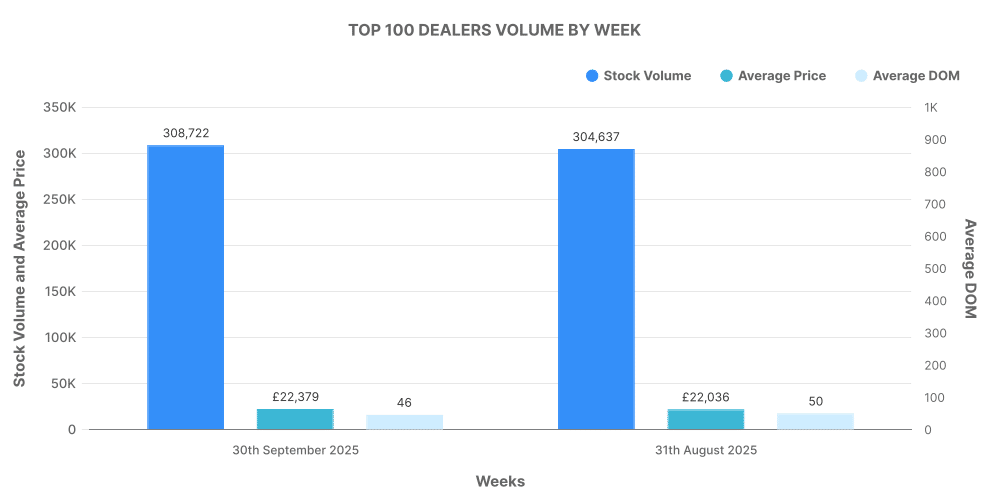
| Dealer Group | Stock Volume | Average Price | Average DOM |
|---|---|---|---|
| Top 100 Dealers | 308,722 | £22,379 | 46 days |
| Outside Top 100 | 487,817 | £16,255 | 91 days |
The performance gap between the top 100 and smaller dealerships remains clear. High-volume operators benefit from pricing agility, stock rotation, and marketing reach, allowing them to move inventory at a faster pace.
Outside the top 100, smaller and independent dealerships represented 61% of listings. Their stock sits at a lower average price, and cars stay on the market for roughly twice as long, suggesting a slower churn but more price-sensitive buyer base.
Overview of the electric used car market
The electric used car market maintained its momentum through September 2025, recording 124,076 listings across 5,108 dealers and 9,567 rooftops.
The average EV price increased slightly to £26,094, a sign of stabilising residual values and continued consumer interest. The average DOM dropped to 62 days, showing that used EVs are continuing to gain traction among both private buyers and trade audiences.
This figure underlines the maturing electric used car market, as more affordable models enter circulation through leasing returns and fleet defleets.
Breakdown of electric listings by price bands
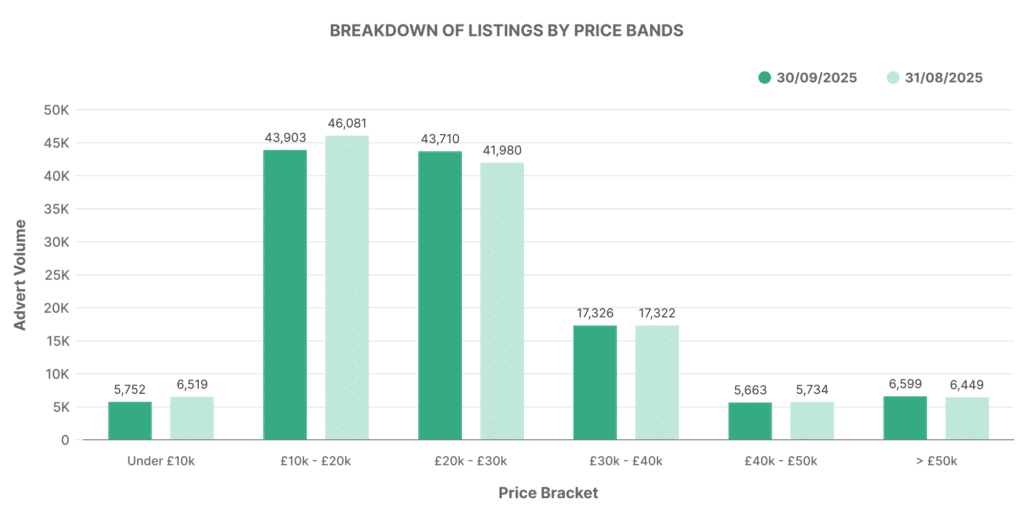
- £0–10K: 5,752 listings
- £10K–20K: 43,903 listings
- £20K–30K: 43,710 listings
- £30K–40K: 17,326 listings
- £40K–50K: 5,663 listings
- £50K+: 6,599 listings
Most electric listings sit in the £10,000–£30,000 range, accounting for nearly 71% of the EV market. This spread reflects the increasing affordability of used EVs, driven largely by the presence of mid-size hatchbacks and crossovers such as the Nissan Leaf, Kia e-Niro, and Hyundai Kona Electric.
A modest proportion of premium models priced above £40,000 indicates steady demand for high-spec EVs from brands such as Tesla, BMW, and Audi.
Dealer volumes in the electric used car market
The electric segment remains heavily dominated by smaller dealer operations:
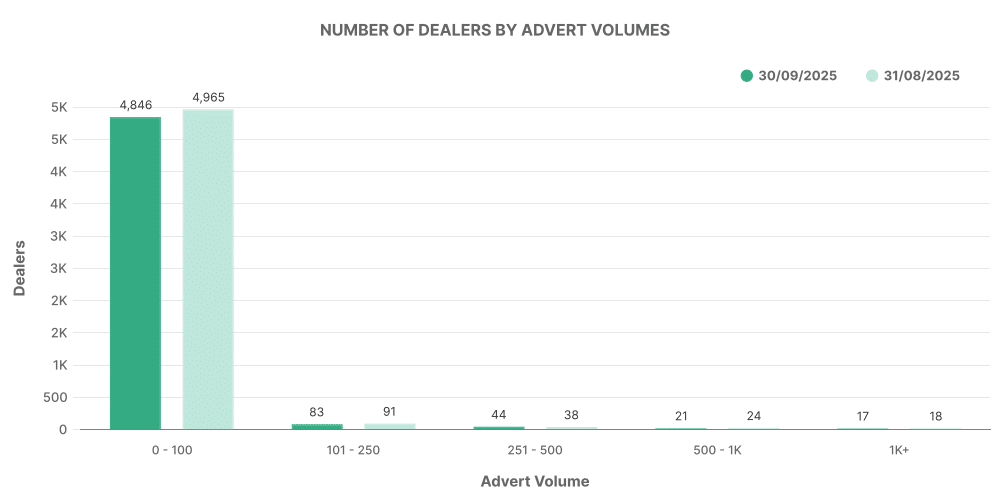
- 0–100 vehicles listed: 6,599 dealers
- 101–250: 4,846
- 251–500: 83
- 501–1,000: 44
- 1,000+: 21
The structure of this distribution points to continued market growth at grassroots level, where independents are cautiously expanding EV inventory but remain selective on price and stock profile.
The top 100 EV dealers accounted for 78,174 listings, or roughly 63% of all EV stock, with an average price of £26,569 and average DOM of 50 days. Compared to the wider market, these dealers are selling faster and typically handle a slightly more premium mix of electric vehicles.
Top 100 dealers vs. wider EV market
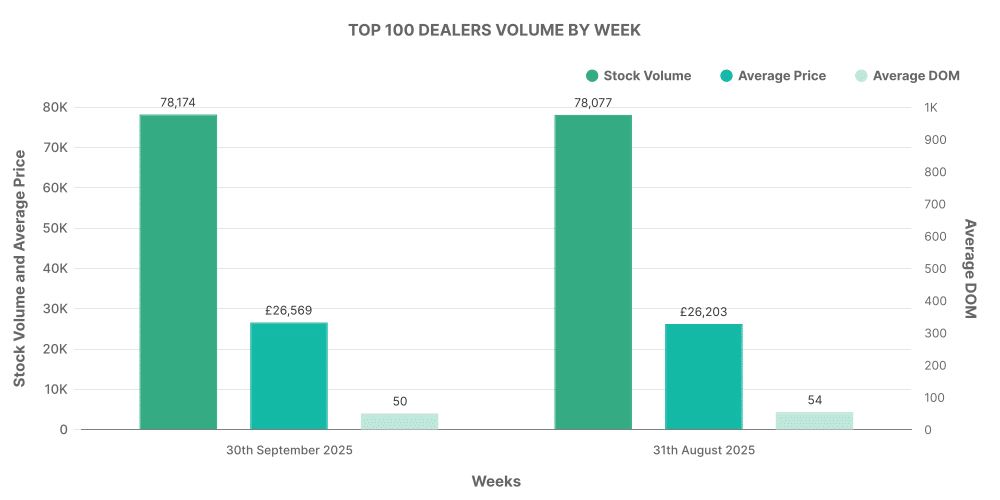
| Dealer Group | Stock Volume | Average Price | Average DOM |
|---|---|---|---|
| Top 100 EV Dealers | 78,174 | £26,569 | 50 days |
| Outside Top 100 | 45,902 | £25,270 | 82 days |
This pattern mirrors the ICE market dynamic, where large groups rotate stock more efficiently. Independent sellers, while growing in number, still rely on lower-priced EVs and longer marketing times to secure buyers.
Comparing electric vs internal combustion listings
The electric used car market represented 15.58% of all used car listings in September 2025, with internal combustion vehicles accounting for 84.42%.
While ICE vehicles continue to dominate, the share of EV listings has edged upward compared with August’s 15.37%. This subtle increase highlights steady growth rather than volatility, confirming that electric adoption in the used sector continues to mature.
| Market Segment | Share of Listings | Average Price | Average DOM |
|---|---|---|---|
| EV | 15.58% | £26,094 | 62 days |
| ICE | 84.42% | £18,662 | 74 days |
Electric vehicles remain higher in value, reflecting the technology premium and lower average age of these vehicles. The difference of around £7,400 in average price between EVs and ICEs shows that while affordability is improving, EVs still represent a slightly more aspirational purchase.
UK car price trends
September 2025 showed modest stability in pricing for both ICE and EV segments.
- ICE average price: £18,662 (up 2.2%)
- EV average price: £26,094 (up 1.5%)
The alignment between retail pricing and stock movement suggests a balanced market, free from the sharp peaks or drops seen in previous years.
The continued appetite for EVs, particularly in the £10,000–£30,000 range, indicates that the electric used car market has transitioned beyond early adoption. Lower running costs and greater vehicle choice are helping dealers move stock faster, with shorter days on market than ICE vehicles.
Automotive market insights
Marketcheck UK data shows consistent trading patterns across September 2025. Dealers are maintaining stock health with moderate turnover, supported by improving consumer confidence.
Key takeaways for industry participants:
- Stock turnover efficiency remains strong, with DOM improvement across both markets.
- Dealer concentration at the top end continues to influence average pricing and overall market stability.
- Electric vehicle share has moved closer to 16%, reflecting gradual but consistent growth.
- Price sensitivity remains evident in the £10K–£20K range, the strongest performing segment for both ICE and EV.
For retailers and investors, these insights reinforce the need for data-led decision-making when managing inventory, pricing strategies, and sourcing.
*includes electric vehicles, petrol hybrids and diesel hybrids.
