Understanding currently available data and trends in the used car market helps car dealers, insurance companies, investment firms, auction houses, and financing entities formulate profitable strategies. This report presents a comprehensive analysis of the latest developments in the UK’s used car market, with a particular focus on the Internal Combustion Engine (ICE) and Electric Vehicle (EV) segments. We explore these trends using the latest market data provided by Marketcheck UK.
Used Car Market Analysis – ICE
For the week of October 4 to October 11, 2024, data shows a total of 622,688 used ICE cars listed by 10,521 dealers in the UK. This represents a slight increase from the previous week’s 602,297 listings by 10,453 dealers. As we examine the data, we focus our attention on significant trends and patterns that could inform strategic decisions. The majority of ICE vehicles fell within the £10,000 – £20,000 price range. Notably, the average listing price decreased slightly from £19,129 (week 40) to £19,084 (week 41).
Dealership Volume Analysis – ICE
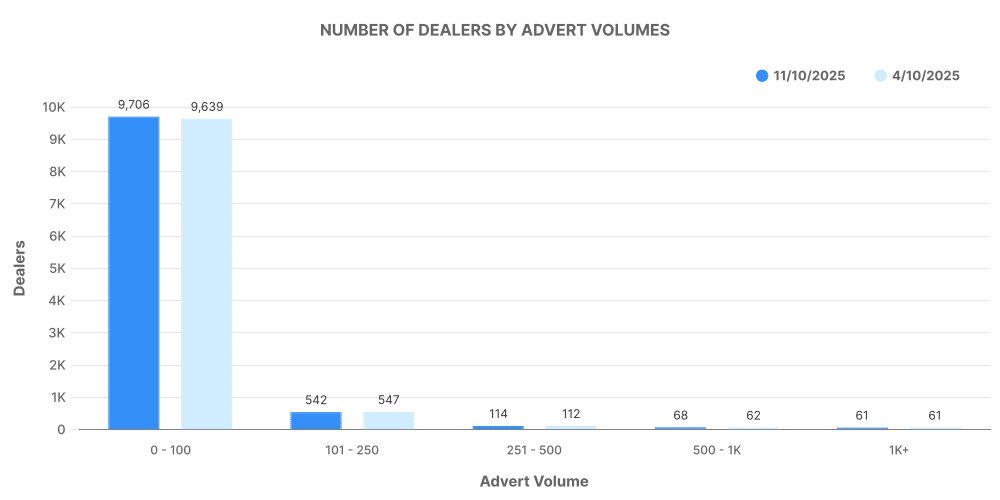
In the ICE market, the spread of listings among dealers was quite diverse. Most dealers listed between 0-100 vehicles, while a significant number of dealers listed between 101-250 vehicles. Interestingly, the number of dealers with 500 or more listings remained stable.
Top 100 Dealers Analysis – ICE
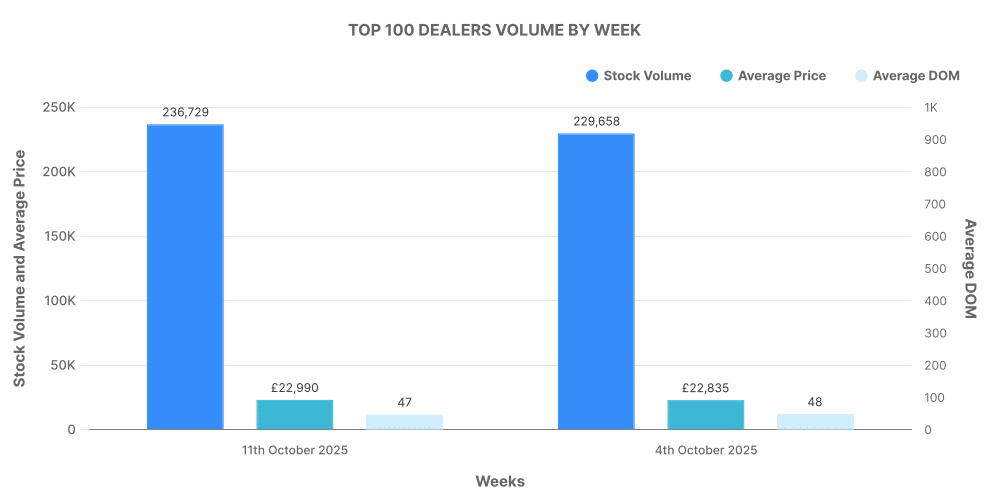
An analysis of the top 100 ICE car dealers reveals interesting patterns and trends. These leading dealers accounted for 15.6% of total listings, maintaining a slightly upward trend from the previous week. The average price of ICE cars listed by these top dealers rose from £22,835 in week 40 to £22,990 in week 41.
Electric Used Car Market Analysis
For the week ending October 11, 2024, there were a total of 35,960 electric vehicles (EVs) listed, which represents an approximate 3.9% increase from the previous week’s 34,605 listings. The number of EV dealers rose slightly to 2,704, up from 2,681 in week 40. EV listings were most abundant in the £10,000 – £20,000 price range. However, a noticeable increase occurred in listings priced over £50,000. As with ICE vehicles, the majority of listed EVs ranged within the £10,000 – £20,000 bracket.
Dealership Volume Analysis – EV
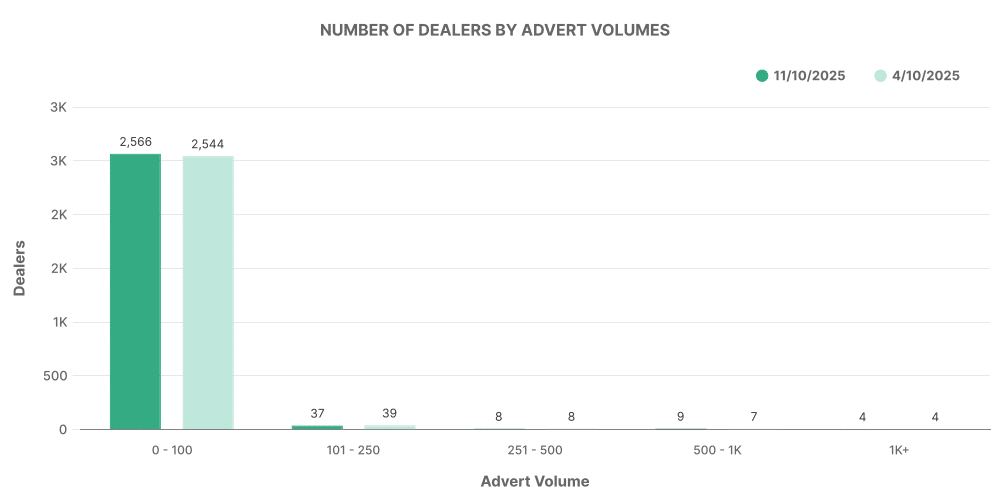
Among EV dealers, most listed between 0-100 vehicles, giving us a clear picture of the disparity in dealership volumes in the used EV market.
Top 100 Dealers Analysis – EV
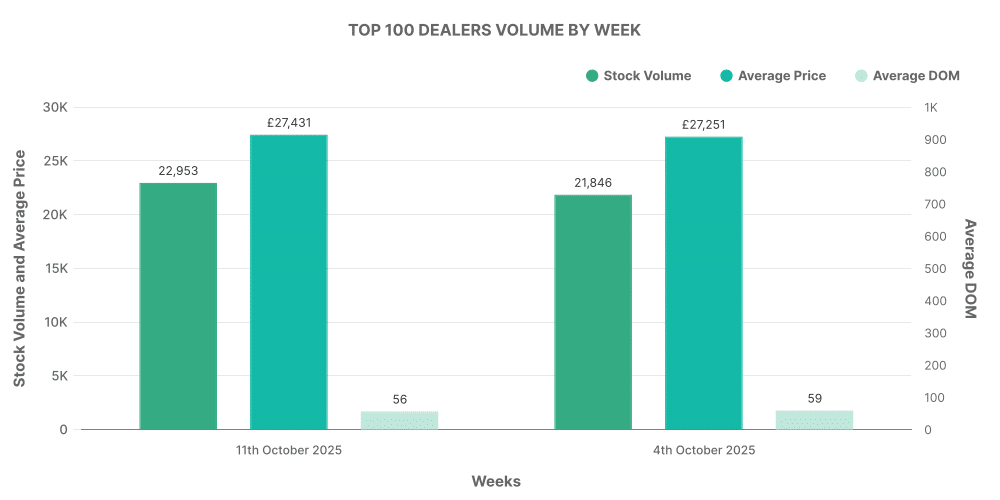
The top 100 dealers accounted for approximately 17.7% of total EV listings. The average price listed by these top dealers amounted to £27,431, a slight increase from the previous week’s £27,251.
Comparison: ICE vs EV
Comparing the ICE and EV markets reveals a persisting disparity in volumes; while ICE vehicles continue to dominate the used car market, the number of used EVs listed is gradually rising. Furthermore, the average listing price of EVs (£26,841) was significantly higher than that of ICE vehicles (£19,084). Notably, the percentage share of EVs increased marginally from 5.75% in week 40 to 5.77% in week 41.