Harnessing the power of automotive data enables us to provide key insights to assist businesses operating within the UK automotive sector. Marketcheck UK meticulously analyses the trends and patterns within the used car market, providing invaluable understandings that empower companies to develop tailored strategies and make smart decisions.
The two main classes of vehicles, Internal Combustion Engine (ICE) vehicles and Electric Vehicles (EV) will be the focus of our analysis, examining how these markets have developed in the week from April 5th to April 12th, 2024.
The Pulse of the Internal Combustion Engine (ICE) Market
The ICE vehicles market remains extensive, with a total of 624,995 used cars listed by 10,682 dealerships. The average price for these vehicles was consistent at £18,948. Here’s the breakdown of the listings:
- Up to £10,000: 181,288
- £10,000 – £20,000: 240,460
- £20,000 – £30,000: 112,660
- £30,000 – £40,000: 39,761
- £40,000 – £50,000: 16,279
- Above £50,000: 22,826
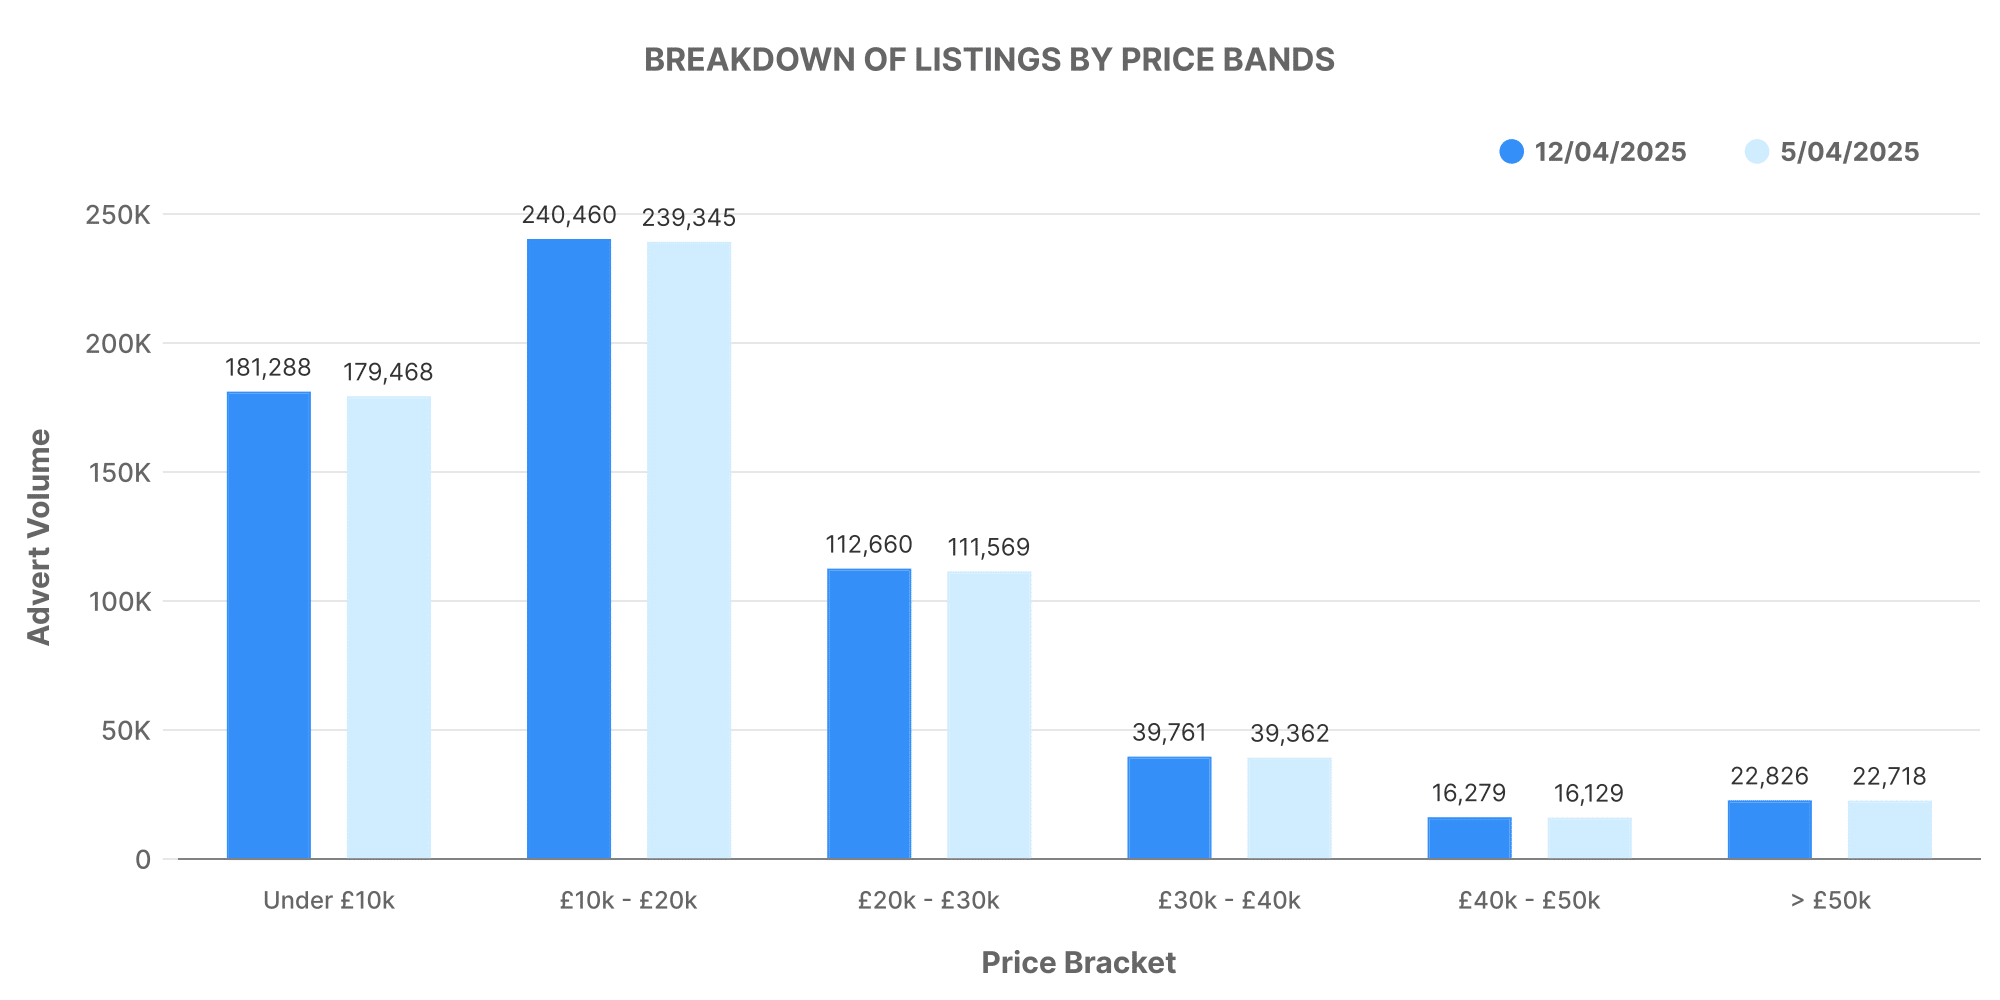
At a glance, the ICE market gravitates towards the lower price bands, particularly the £10,000 – £20,000 range, underscoring the appeal of affordability in this market segment.
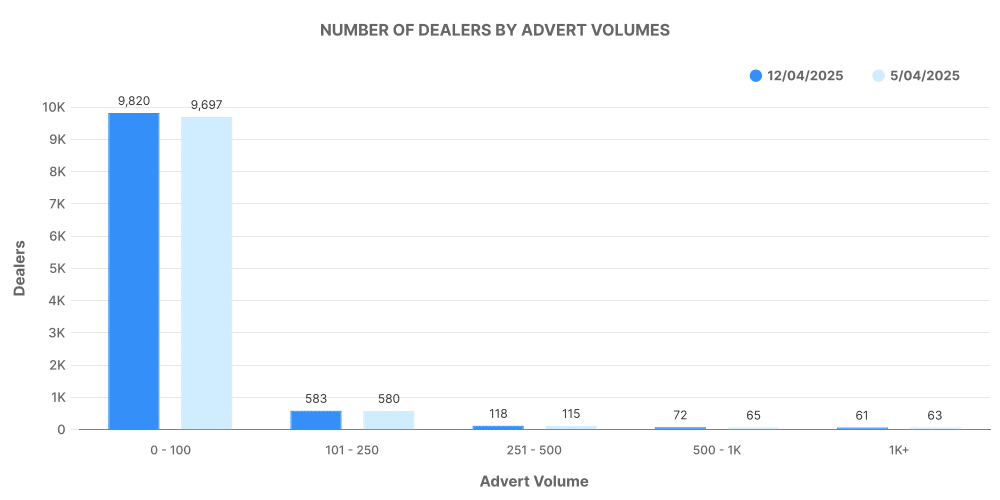
When examining dealer volume, a vast majority of dealerships list between 0-100 vehicles. This is equally spread amongst larger volume dealerships, indicating a well-balanced market distribution.
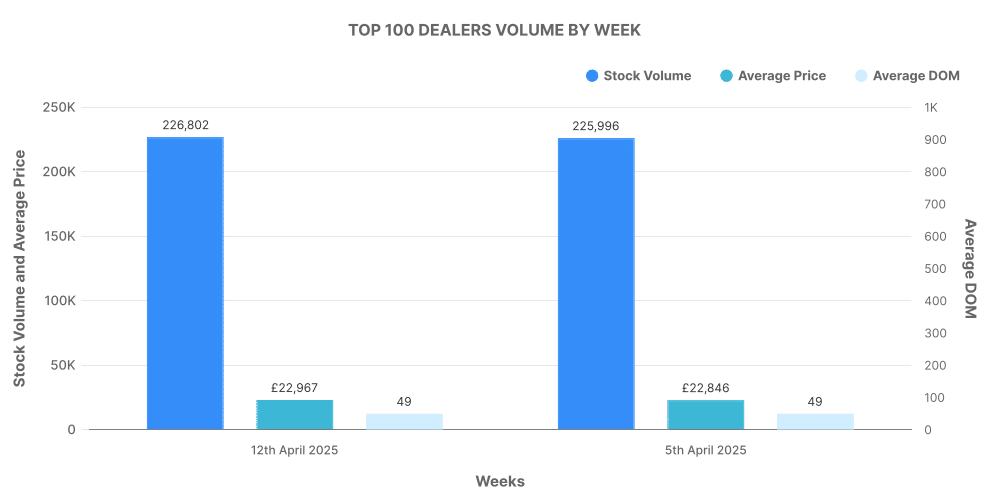
Within the top 100 dealers, they accounted for a total of 226,802 listings, suggesting that there is a small concentration of dealerships with sizeable proportions of the overall market share.
Electric Vehicles (EV) – A Rising Phenomenon
The used EV market, while smaller in size, is experiencing pronounced growth. The week saw a total of 99,462 used EVs listed by 4,731 dealerships. The average price of these vehicles (£26,569) was noticeably higher than their ICE counterparts.
All measurements are presented as follows:
- Up to £10,000: 4,088
- £10,000 – £20,000: 36,250
- £20,000 – £30,000: 32,502
- £30,000 – £40,000: 14,038
- £40,000 – £50,000: 5,555
- Above £50,000: 5,826
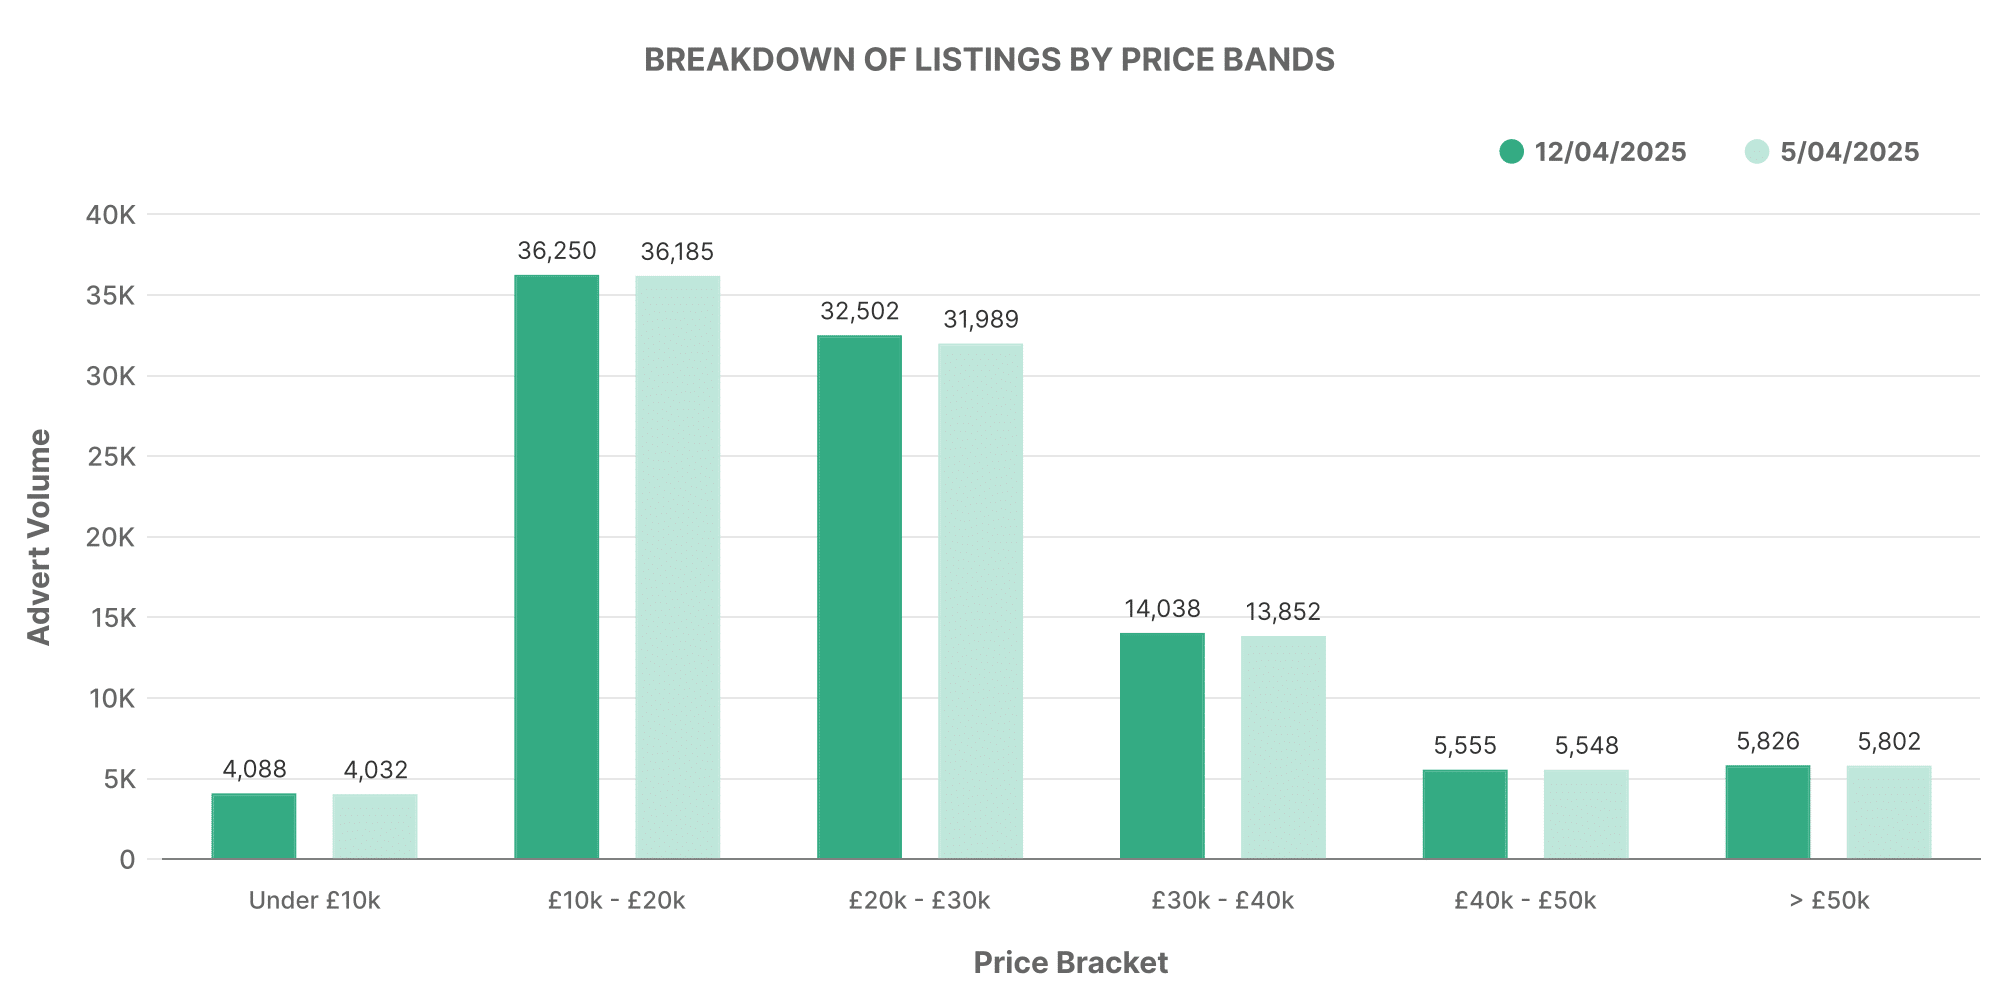
EV listings reveal a gradual concentration in the slightly upper price bands.
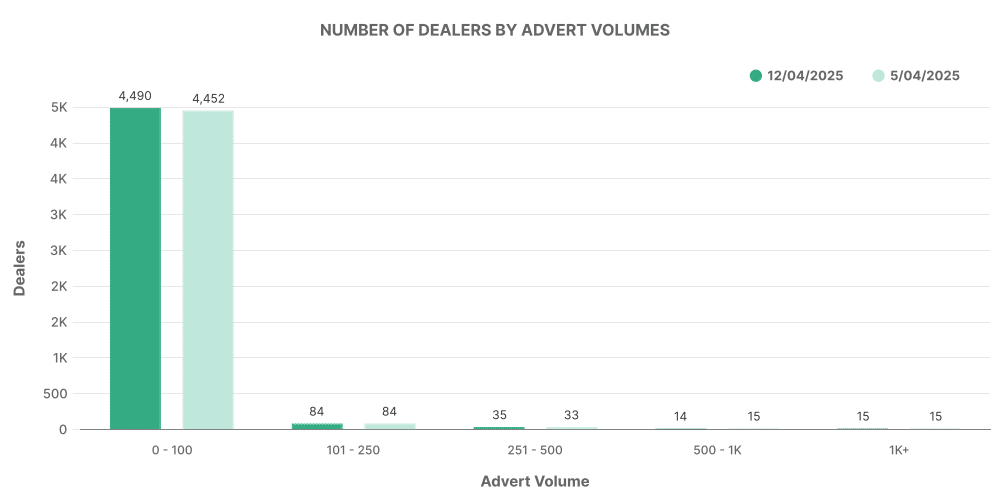
As with the ICE market, most EV dealers list between 0-100 vehicles. This concentration within smaller volume dealerships indicates early-stage market growth.
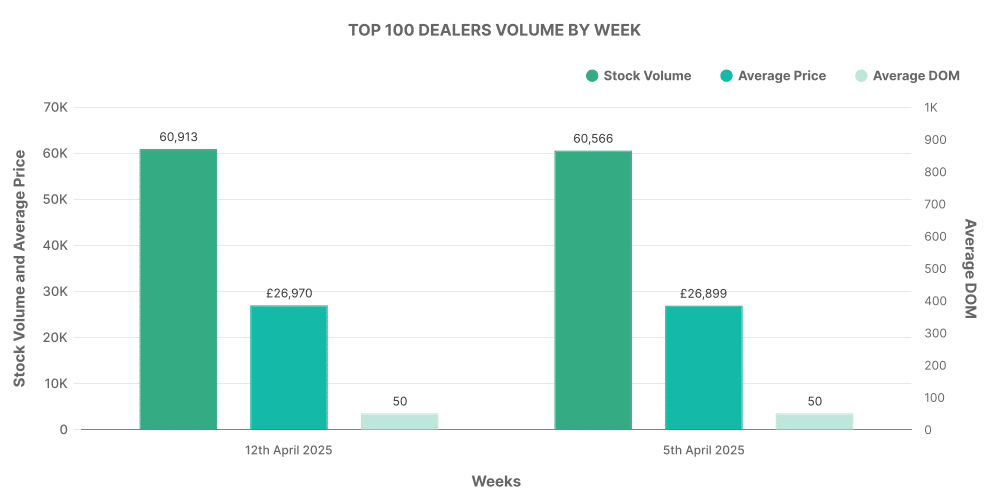
The top 100 dealers for EVs account for 60,913 listings, confirming a large portion of the UK used EV market is handled by a relatively small number of dealers.
Comparison: ICE vs EV
It’s clear that the ICE market dwarfs the EV market in terms of volume. However, a diverging trend is observed in the average listed price. EVs are generally priced higher, potentially due to their modern technology, lower running costs, and environmental benefits.
Nevertheless, the apparent growth of the EV market, coupled with changing consumer attitudes towards greener vehicles, suggests this sector will challenge the traditional dominance of the ICE market. The increasing diversity in EV pricing shows signs of maturation and the potential for this market to accommodate a broader range of customer needs.
