Understanding the trends in the used car market sector is a key requirement for all businesses working within the UK automotive industry. Recognizing shifts in the market only adds weight to future strategies for businesses like car dealers, insurance companies and car finance lenders. This report will examine data for both the used and electric used car market, providing automotive market insights into trends and UK car price movements.
Observation of the Traditional Used Car Market (ICE)
For the week ending July 12, 2025, we saw a total of 612,029 used Internal Combustion Engine (ICE) cars listed. These vehicles were listed by a total of 10,601 dealerships.
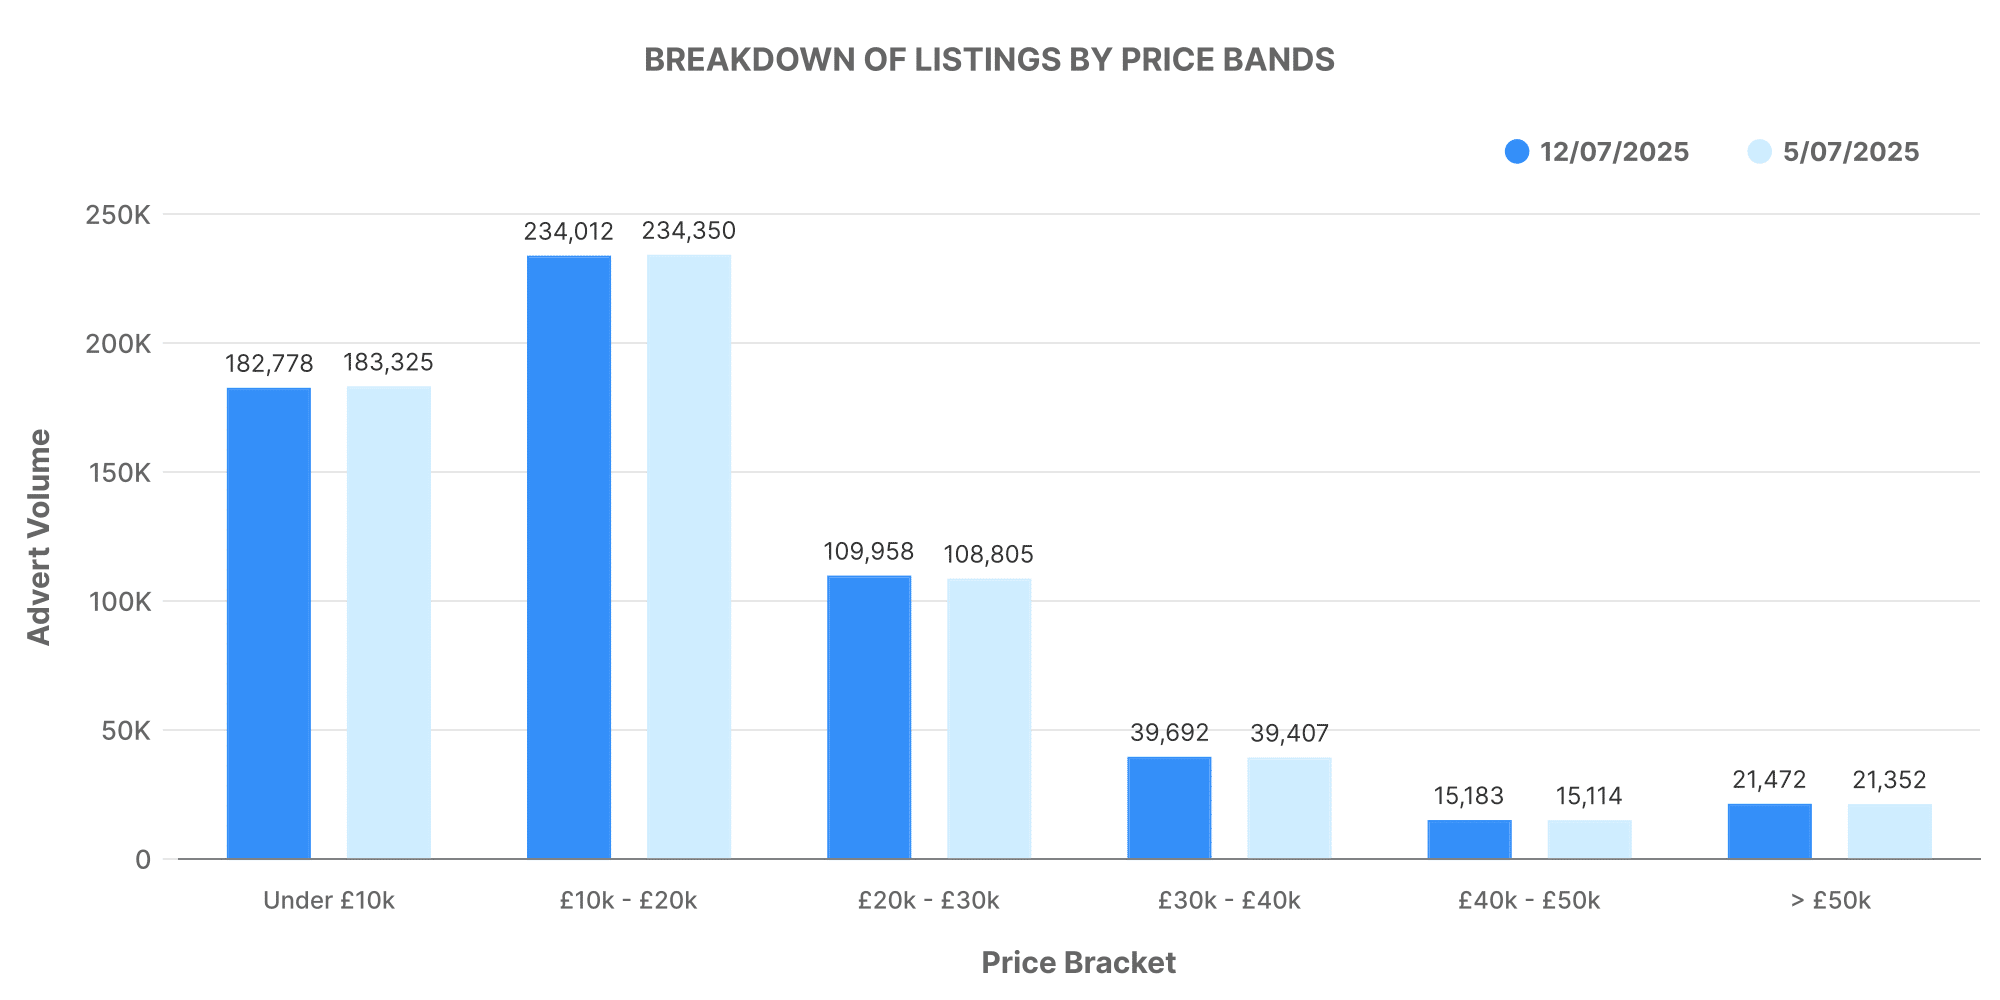
Looking at the price bands of the listed vehicles, we found the majority of the ICE vehicles priced within the £10,000 – £20,000 range. However, it’s worth noting that the average price of these ICE cars was £18,769, with several of them priced above £50,000.
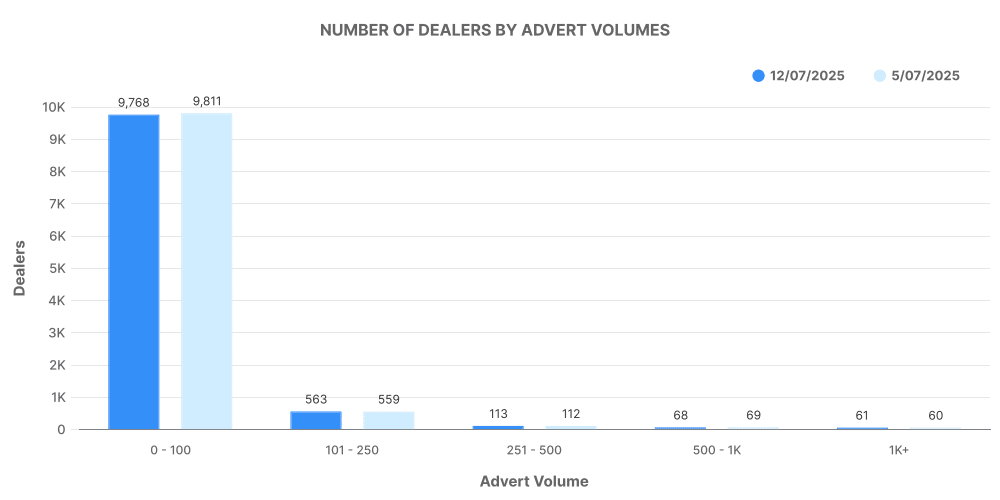
Analyzing the listing volume by dealerships reveals interesting insights:
- Most dealerships listed between 0-100 vehicles in the given week, indicating a sizeable competition among the dealers who were likely dealing in a broad variety of vehicle types and models.
- A notable focus of our analysis was the top 100 dealerships by listing volume for ICE vehicles.
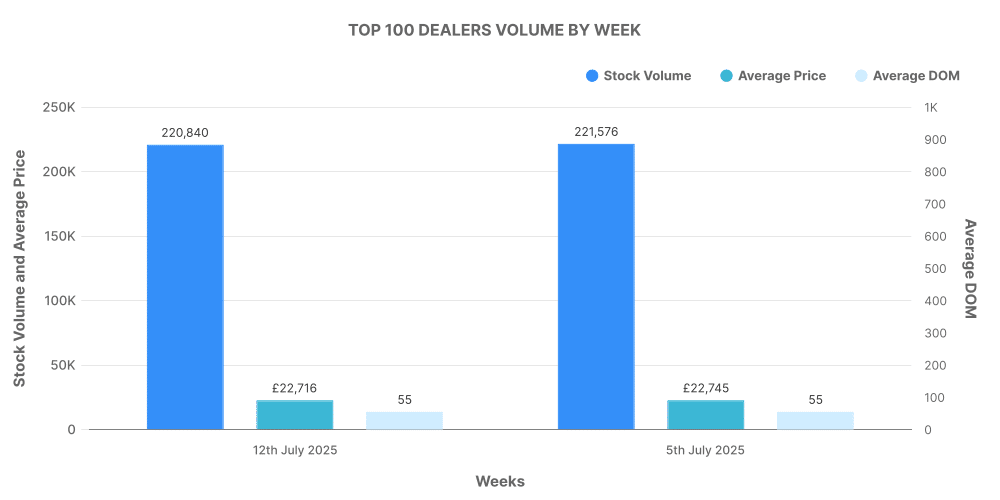
This segment accounted for approximately 36% of total ICE vehicle listings, with an average price (£22,716) higher than the market average.
The Rising Importance of the Electric Used Car Market (EV)
The electric used car market (EV) saw a total of 95,950 vehicles listed by 4,788 dealers for the same period.
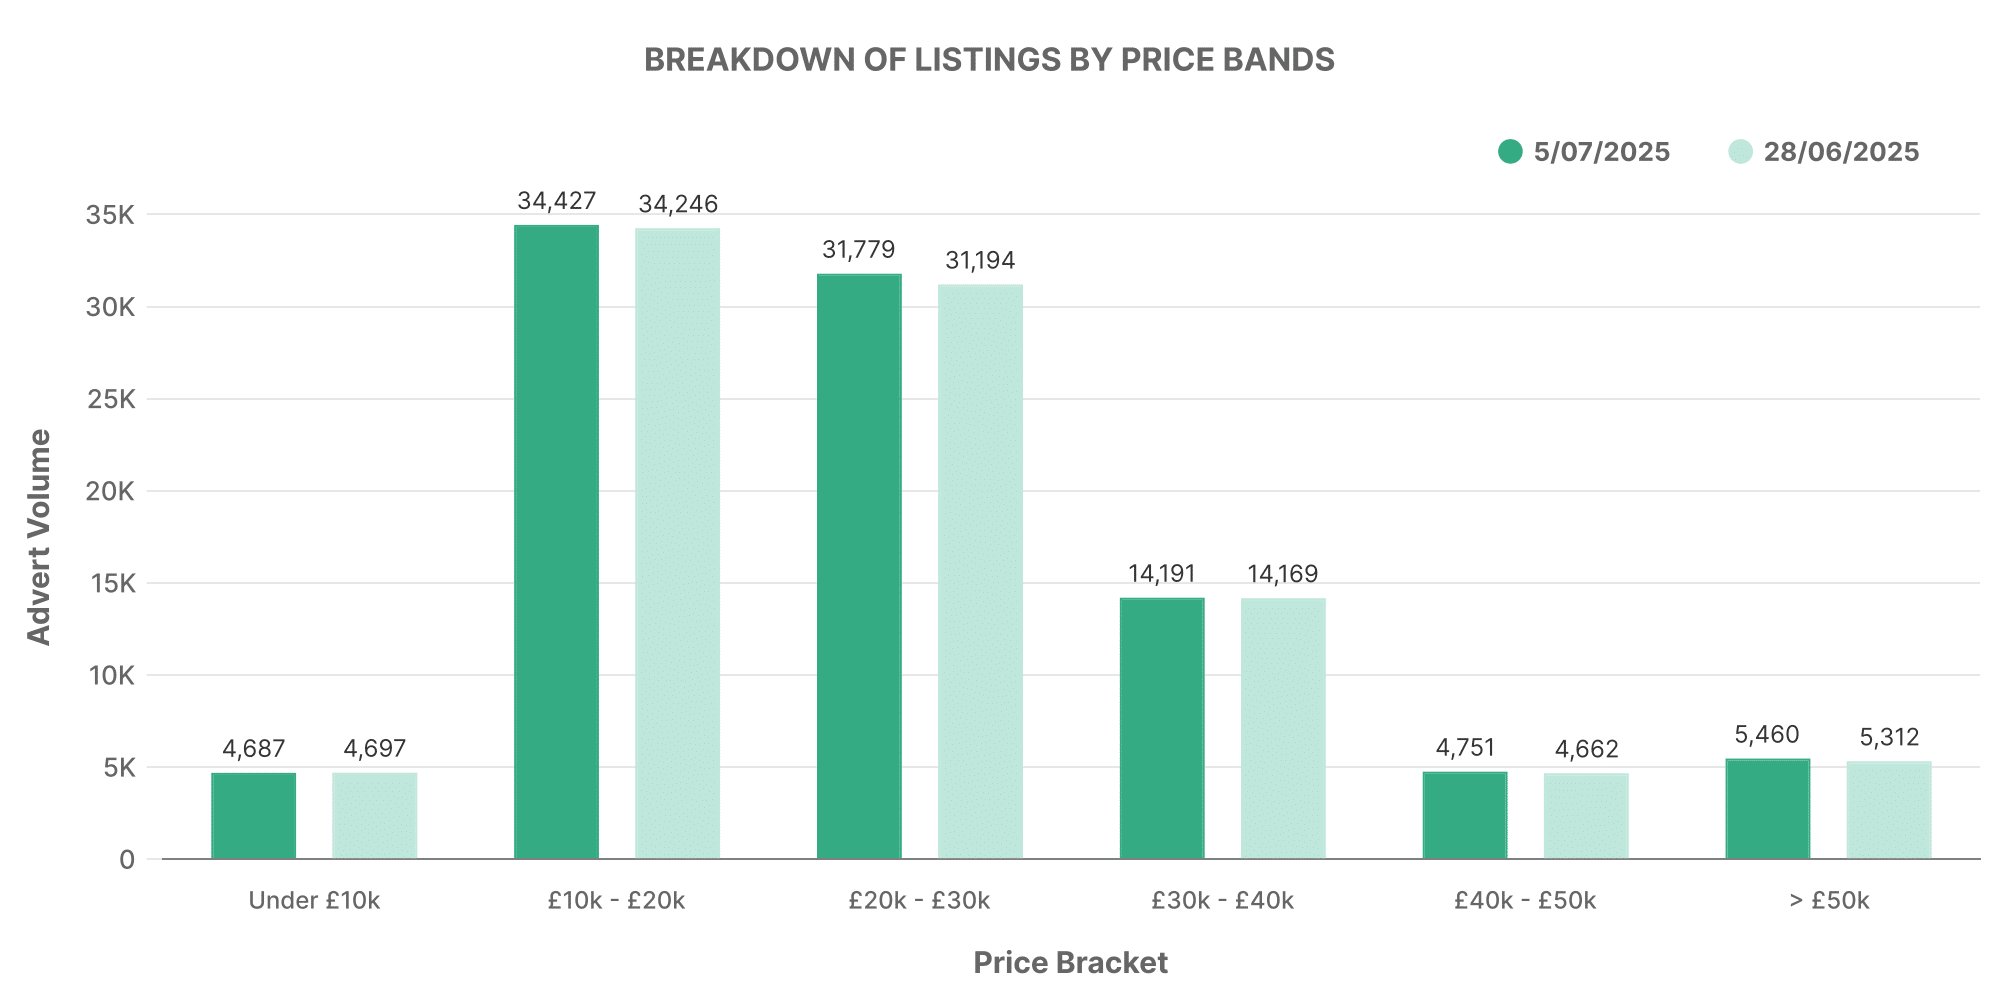
These listings show a significant number of EVs priced within the £10,000 – £20,000 range. However, there was an increase in the average price of EVs listed, at £26,359, hinting at an increase in consumer willingness to pay more for electric vehicles.
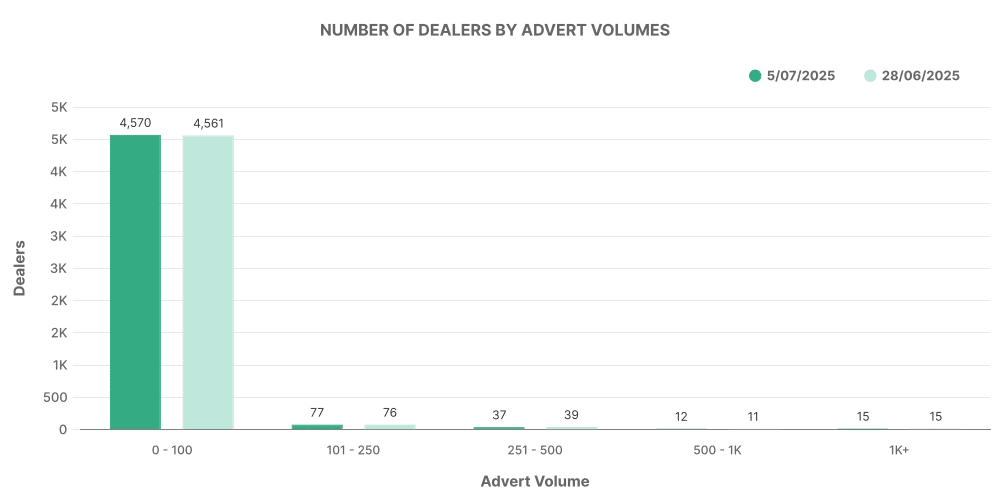
Examining the dealer volume for EVs provided another interesting perspective:
- Contrary to the ICE market, the majority of EV dealers listed between 0-100 vehicles. This indicates a nascent market, yet dynamic and swiftly expanding.
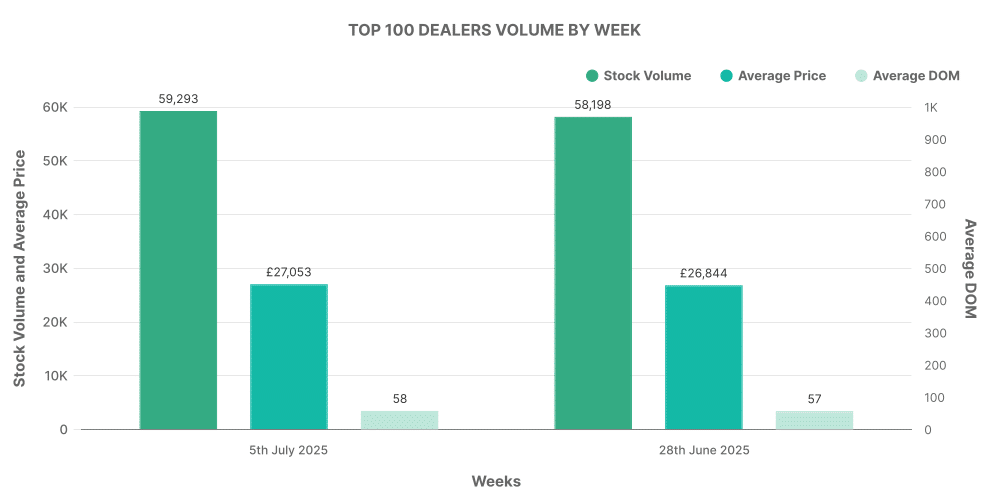
- The top 100 EV dealers accounted for 62% of all EV listings and were selling vehicles at an average price (£27,053) higher than the market average, pointing towards a trend of premium electric vehicles being traded more.
Comparison: ICE Vs EV
Comparing percentage share of EVs and non-EVs, we notice that the percentage share of EVs in total listings has slightly increased from 15.64% (week 26) to 15.69% (week 27). Moreover, the average price of EVs has seen an upward trend, emphasizing the growing consumer preference for environmentally friendly and technologically advanced cars.
