
Welcome to our comprehensive analysis of the UK used car market data for the week ending 13th July 2024. This report delves into the latest trends and insights, focusing on both internal combustion engine (ICE) vehicles and electric vehicles (EVs). With a rapidly evolving market, understanding the nuances of these segments is crucial for automotive dealers. Here, we provide detailed observations and analysis based on the latest data to help you stay informed and make strategic decisions.
ICE Used Car Market Overview
Overall Market Trends
For the week ending 13th July 2024, the UK used car market for ICE vehicles exhibited some interesting trends. The total number of dealers slightly decreased from 10,804 to 10,802. The total listings also saw a minor increase, rising from 902,047 to 910,656, which indicates a robust supply in the market.
- Total Listings: 910,656
- Average Days on Market (DOM): 83
- Average Price: £18,004
Price Band Analysis
Breaking down the listings by price bands provides a clearer picture of market segmentation:
- £0-10K: 195,159 listings
- £10-20K: 222,348 listings
- £20-30K: 97,976 listings
- £30-40K: 35,628 listings
- £40-50K: 14,499 listings
- £50K+: 19,243 listings

The majority of listings fall within the £10-20K band, which remains the most active price segment.
Dealer Inventory Volume
Analysing dealer inventory volumes, we observe the following distribution:
- 0-100 vehicles: 9963 dealers
- 101-250 vehicles: 548 dealers
- 251-500 vehicles: 121 dealers
- 500-1K vehicles: 69 dealers
- 1K+ vehicles: 52 dealers
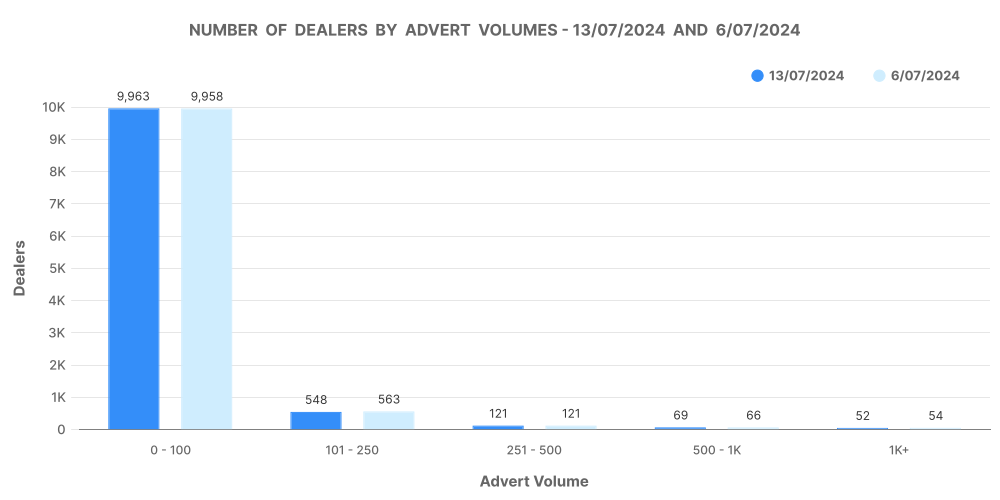
The largest number of dealers maintain a stock of 0-100 vehicles, underscoring a market dominated by smaller dealerships.
EV Used Car Market Overview
Overall Market Trends
The electric used car market continues to grow, albeit at a slower pace compared to its ICE counterpart. For the week ending 13th July 2024, the total number of dealers in the EV segment slightly increased from 4,412 to 4,421. The total EV listings rose from 132,144 to 133,755.
- Total Listings: 133,755
- Average Days on Market (DOM): 69
- Average Price: £27,480
Price Band Analysis
Here’s how EV listings are distributed across different price bands:
- £0-10K: 3,285 listings
- £10-20K: 24,877 listings
- £20-30K: 22,566 listings
- £30-40K: 11,699 listings
- £40-50K: 4,929 listings
- £50K+: 4,797 listings

The £10-20K price band is also the most active for EVs, similar to the ICE market, but with a notably higher average price.
Dealer Inventory Volume
The distribution of dealer inventory volumes for EVs is as follows:
- 0-100 vehicles: 4,797 dealers
- 101-250 vehicles: 4185 dealers
- 251-500 vehicles: 74 dealers
- 500-1K vehicles: 22 dealers
- 1K+ vehicles: 12 dealers

The data indicates a concentration of dealers with smaller inventories, similar to the ICE market.
Comparative Analysis: ICE vs. EV
Market Share
Electric vehicles (EVs) accounted for 12.32% of the total used car market, with ICE vehicles making up the remaining 87.68%. This distribution highlights the growing presence of EVs but also shows that ICE vehicles continue to dominate the market.
- Percentage Share of EVs: 12.32%
- Percentage Share of ICEs: 87.68%
Price Comparison
EVs maintain a higher average price compared to ICE vehicles. The average price for EVs is £27,480, while ICE vehicles have an average price of £18,004. This price disparity underscores the premium associated with electric vehicles, likely due to newer technology and higher demand.
- Average Price of EVs: £27,480
- Average Price of ICEs: £18,004
Market Analysis and Insights
Breakdown of Listings by Price Bands
Our analysis reveals that the £10-20K price band remains the most active for both ICE and EV markets. This consistency indicates a significant consumer demand within this price range, possibly due to its affordability and value for money. For dealers, focusing on vehicles within this segment could enhance sales and turnover rates.
Number of Dealers by Advert Volumes
The majority of dealers maintain smaller inventories (0-100 vehicles), both in the ICE and EV segments. This trend suggests a market landscape dominated by smaller, possibly independent dealerships. For larger dealerships, understanding this dynamic could present opportunities for market consolidation or targeted marketing strategies to capture a larger share of the market.
Analysis of Top 100 Dealers by Volume
For ICE vehicles, the top 100 dealers have an average stock volume of 210,922 vehicles, with an average DOM of 52 days and an average price of £21,675. In the EV market, the top 100 dealers hold a stock volume of 44,741 vehicles, with an average DOM of 57 days and an average price of £27,981. These figures indicate that top dealers manage to sell their stock relatively quickly and at higher prices, highlighting the effectiveness of their sales strategies and possibly their reputations.


Relevance of Marketcheck UK
Marketcheck UK stands out as an invaluable resource for automotive dealers, offering comprehensive data on every current and historical used car advert listing in the UK. By providing data through various formats such as CSV feeds, APIs, Website Tools, Spreadsheets, and Looker analysis tools, Marketcheck UK ensures that dealers have access to real-time, actionable insights.
With our data, dealers can:
- Optimise Inventory: Understand which price bands and models are most in demand.
- Strategise Pricing: Set competitive prices based on current market trends and average pricing data.
- Enhance Sales Strategies: Identify which makes and models sell quickly and adjust marketing efforts accordingly.
- Stay Ahead of Trends: Monitor the growing EV market and adjust inventory and pricing to meet rising demand.