Understanding the rhythm and patterns in the used car market is integral for dealers, insurance companies, and investment firms involved in the automotive sector. Focused on offering precise automotive market insights, Marketcheck UK provides an extensive analysis of the used car market trends, specifically highlighting the electric used car market dynamics. The objective is to significantly impact strategies and growth planning for businesses. This week, we’ll consider the data from weeks 36 and 37 – from 30th August to 13th September 2025.
Shining Spotlight on the Combustion Engine Vehicle Market
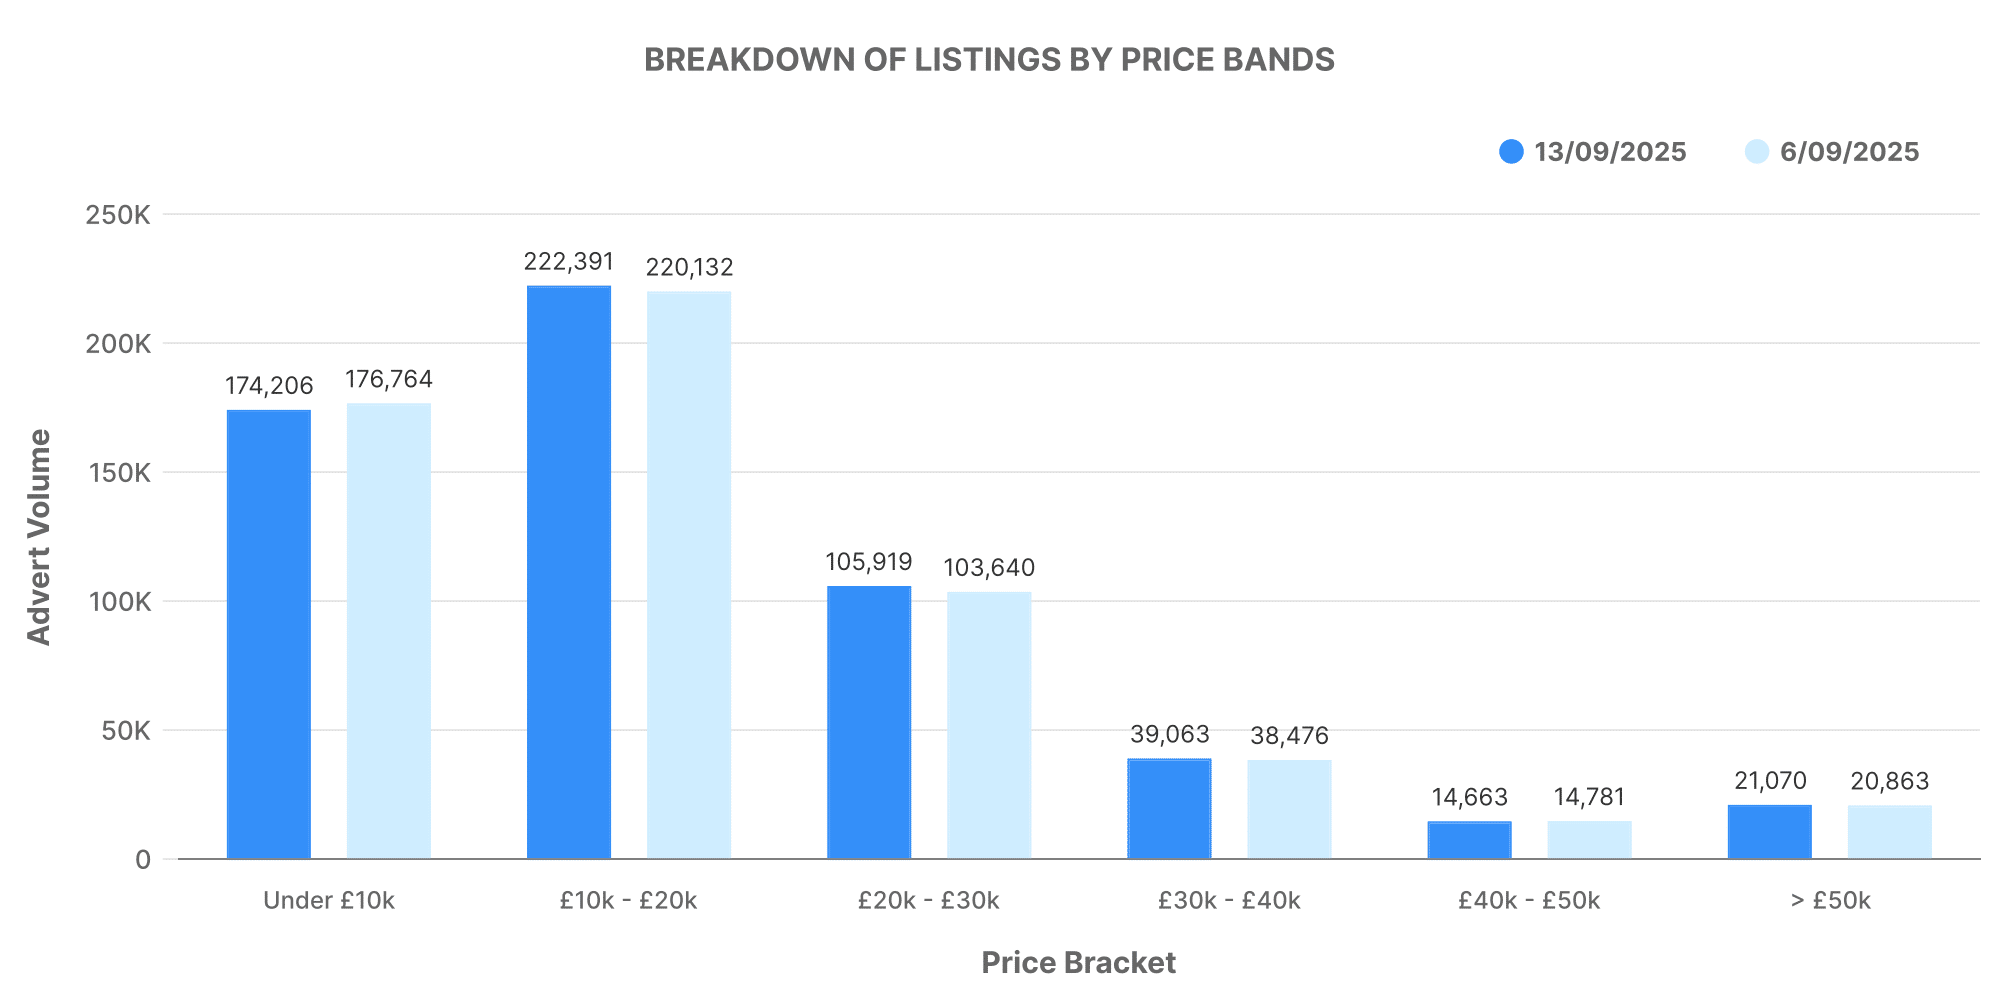
During week 36, the data indicated the availability of 584,463 used internal combustion engine vehicles (ICE) across 10,597 dealers. A week later, this number experienced a slight uptick, resulting in a total of 587,045 used ICE cars listing from 10,542 dealers. There is a minimal 0.44% increase in car listings, indicating market stability. Most ICE listings priced within the £10,000 – £20,000 band during both weeks, followed by a significant number in the £20,000 – £30,000 range. A less than 2% difference in the average price is observed, resulting in £18,788 in week 36 and £18,864 in week 37.
The Rise of Electric Used Car Market
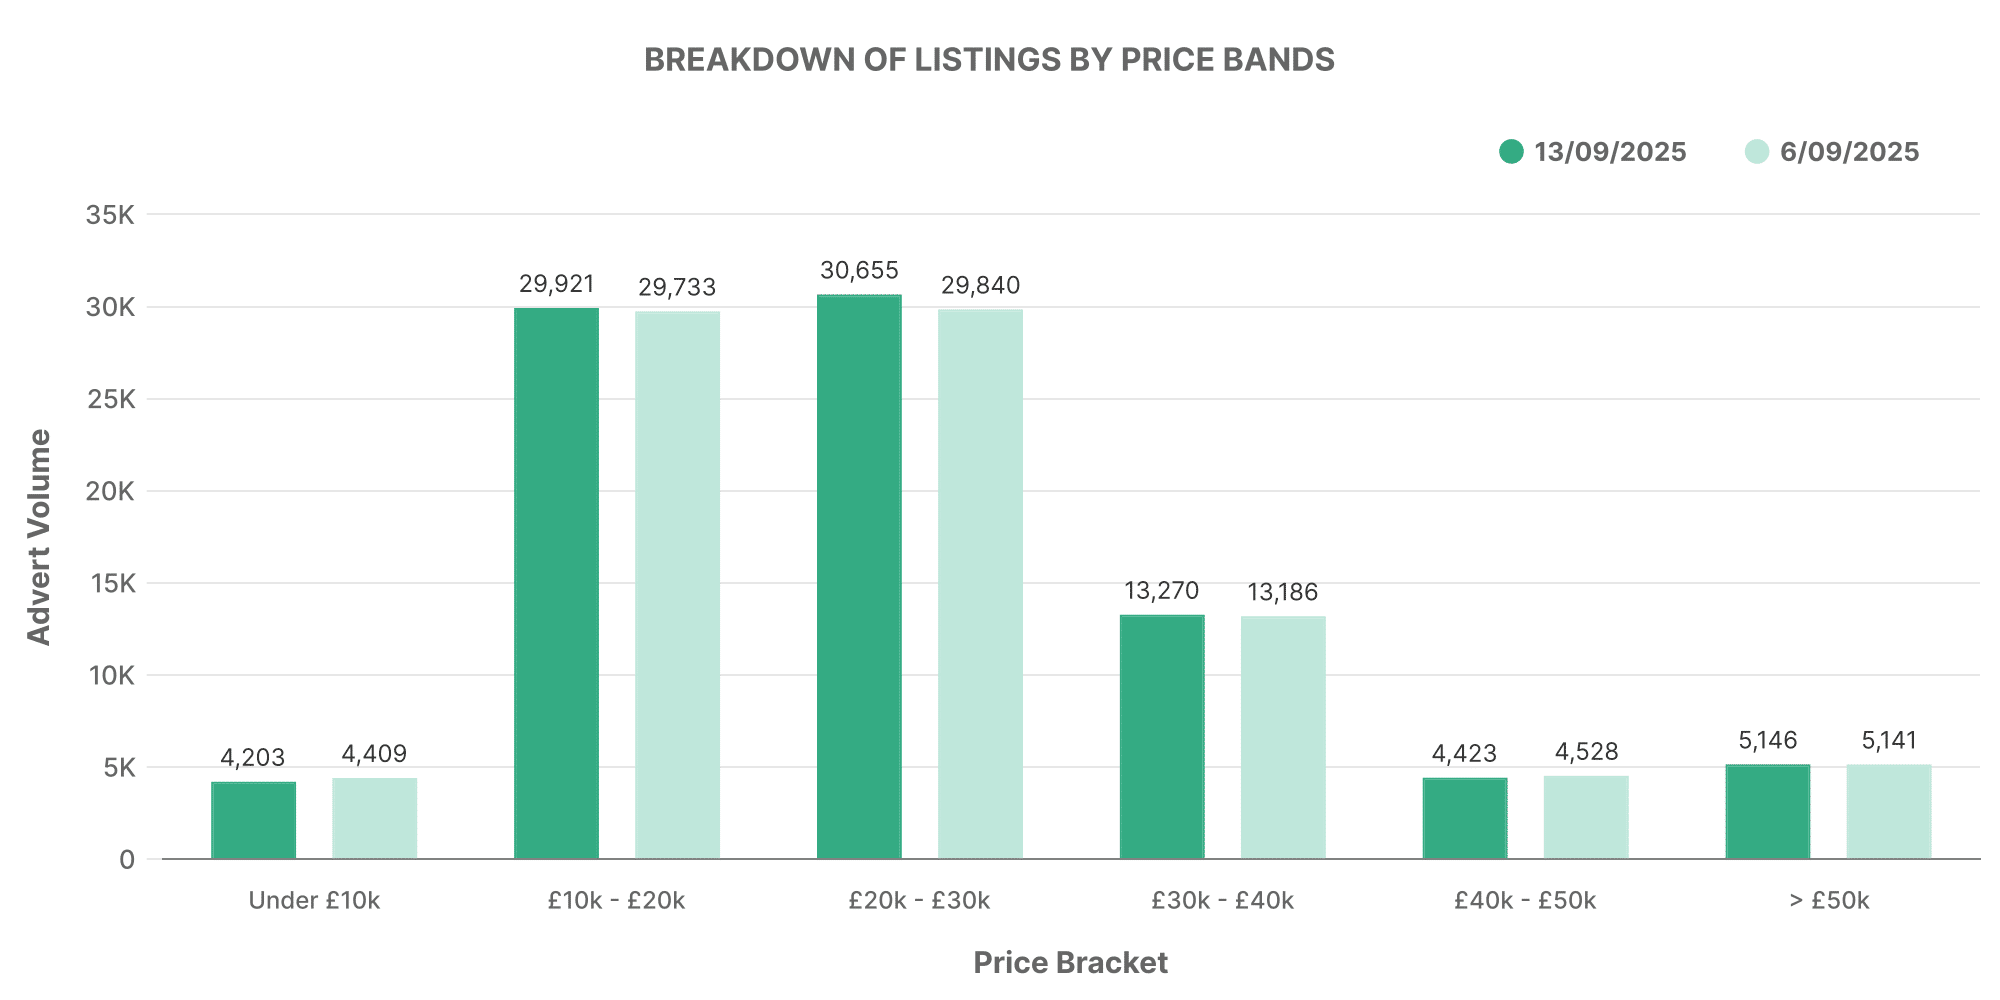
During the same period, the electric vehicle (EV) market experienced a 0.85% growth in dealer volumes, from 87,473 listings by 4,753 dealers in week 36 to 88,216 cars listed by 4,713 dealers in week 37. In terms of used EV listings, most cars fall within the £10,000-£20,000 price band. However, there is also a considerable listing in the £20,000-£30,000 band, thus adding variety to the market.
Comparison: ICE vs EV
In week 37, the average price comparison reveals that used EVs (~£26,704) continue to hold a higher market price compared to ICE cars (~£18,864).
Analysing Dealer Volumes
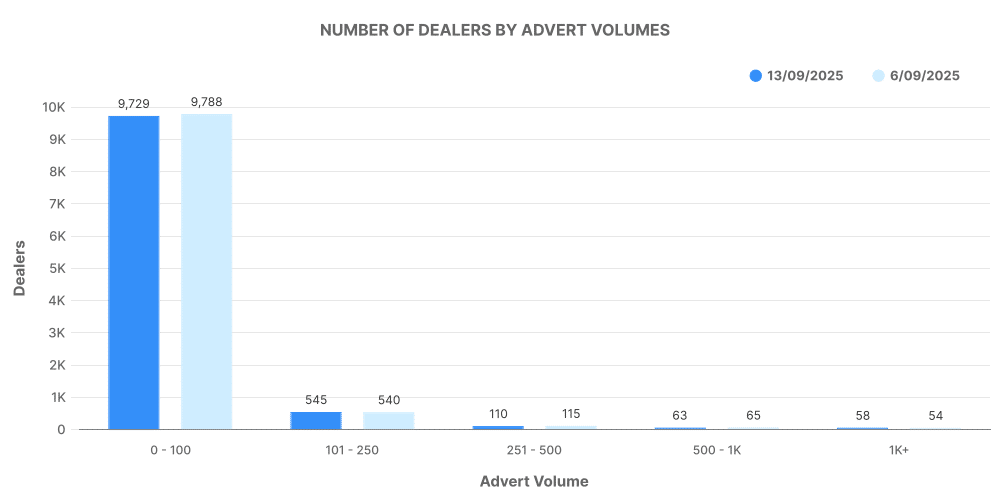
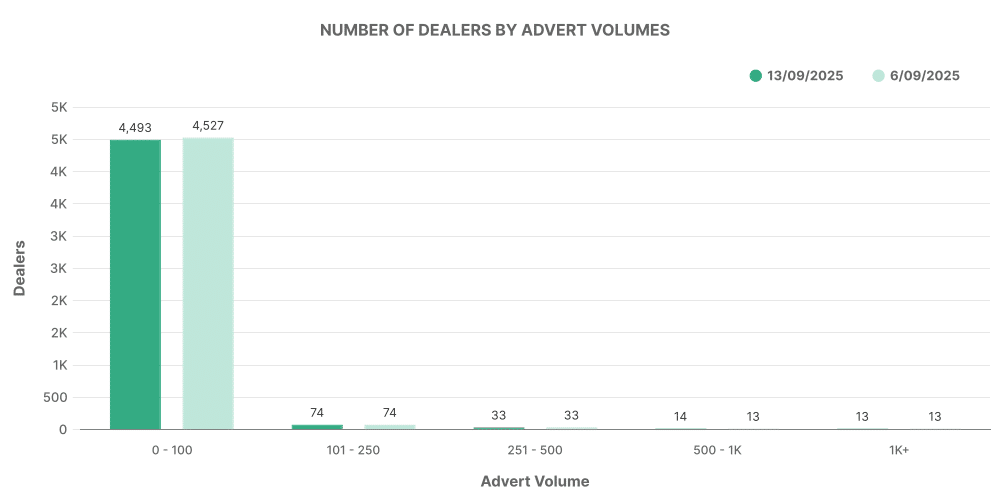
Dissecting dealership volumes for both ICE and EVs grants further clarity into the market dynamics. For ICE vehicles, there is an increase in dealers with car listings ranging from 0-100 vehicles, solidifying the market’s stable stature. For electric cars, dealers listing between 0-100 vehicles signal a small growth indicating EV market’s evolving nature.
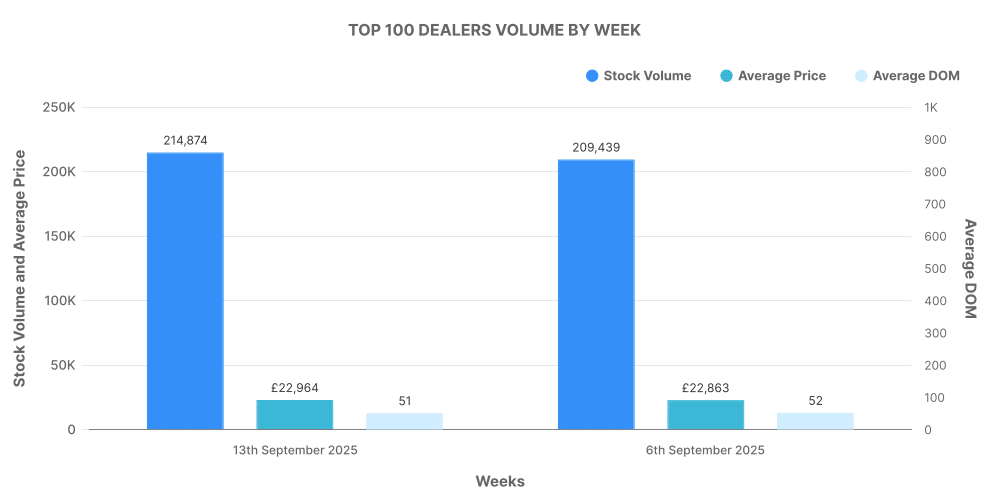
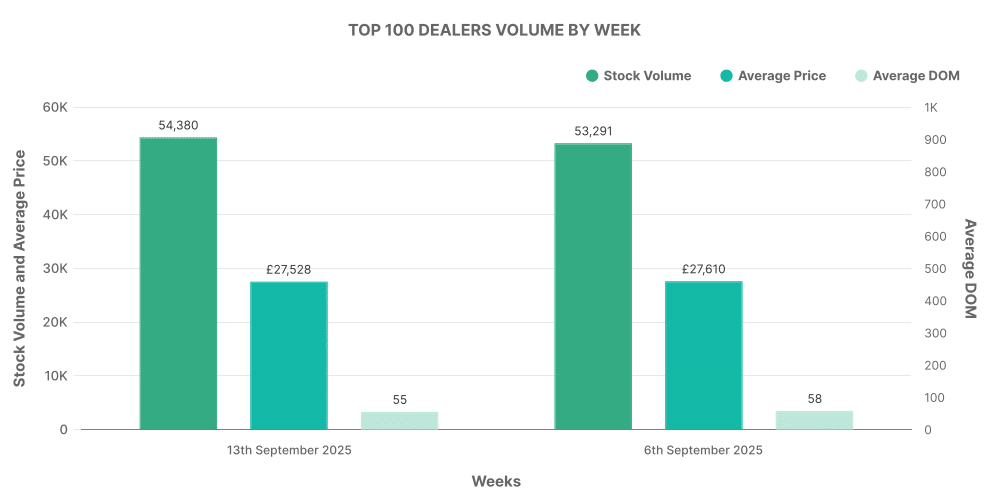
Investigating Top 100 Dealers
Next, let’s evaluate the performance of the top 100 dealerships. For ICE vehicles, the top 100 dealers accounted for 36.8% of total listings, with an average price slightly more than the market average. On the electric vehicles front, the top 100 dealers contributed 61.7% to total listings, also cataloguing vehicles priced above the average EV market rate. *includes electric vehicles, petrol hybrids and diesel hybrids.