Monitoring the constantly evolving patterns in the used car market is a key focus for businesses across the UK automotive sector. This report will analyse the used car market data, encompassing not only internal combustion engine vehicles (ICE), but also the electric used car market (EV), offering invaluable automotive market insights.
An Overview of the EV Market
Electric vehicles (EVs) have been steadily gaining ground in the used car market, reflecting changing consumer preferences and environmental consciousness. For the week commencing 7th June and ending 14th June, the market witnessed 95,268 used electric vehicles listed by 4,742 dealers, demonstrating a continuously expanding market.
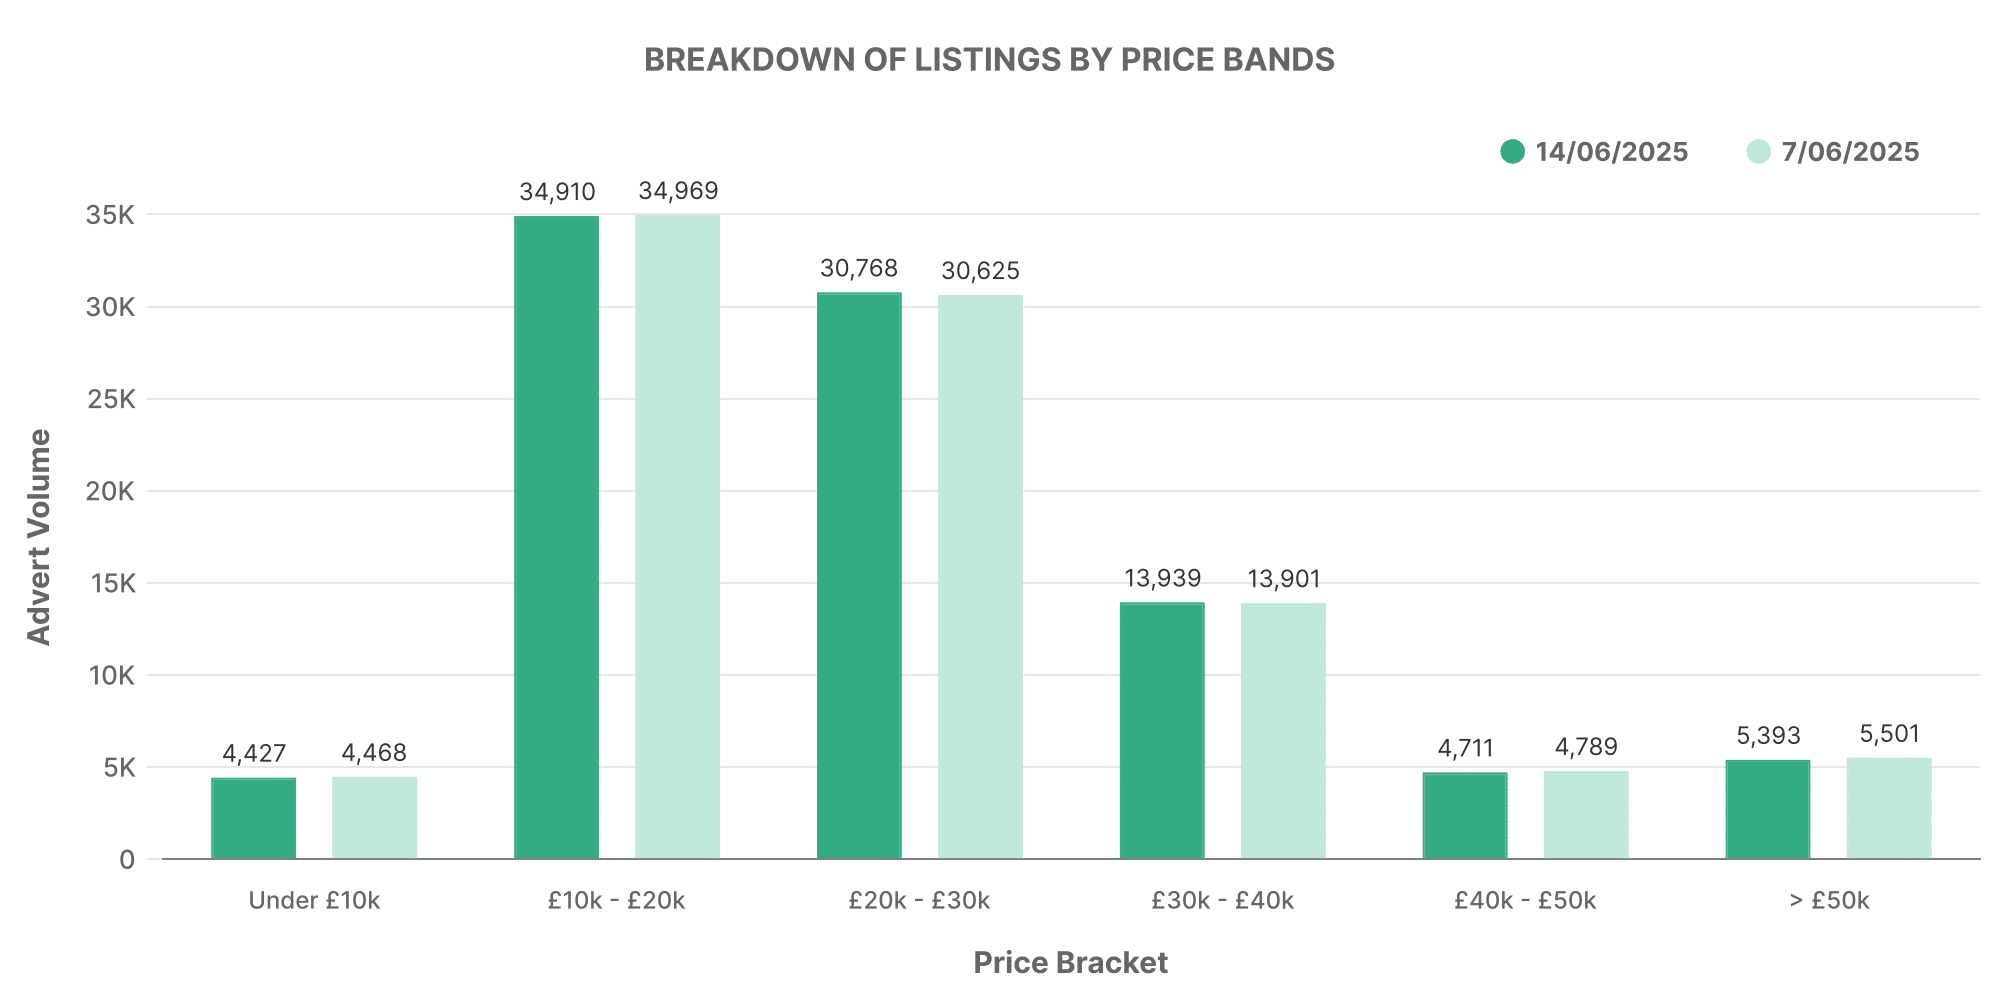
This graph represents the distribution of listed EVs across different price bands. A bulk of listed EVs fell within the £10,000 – £20,000 bracket, closely followed by a significant count in the £20,000 – £30,000 range. More premium models, priced above £50,000, continue to add variety to the market.
Moving Towards ICE Vehicles
In contrast, conventional combustion engine vehicles painted a different story. In the same time frame, a total of 605,793 used ICE cars were listed by 10,636 dealers.
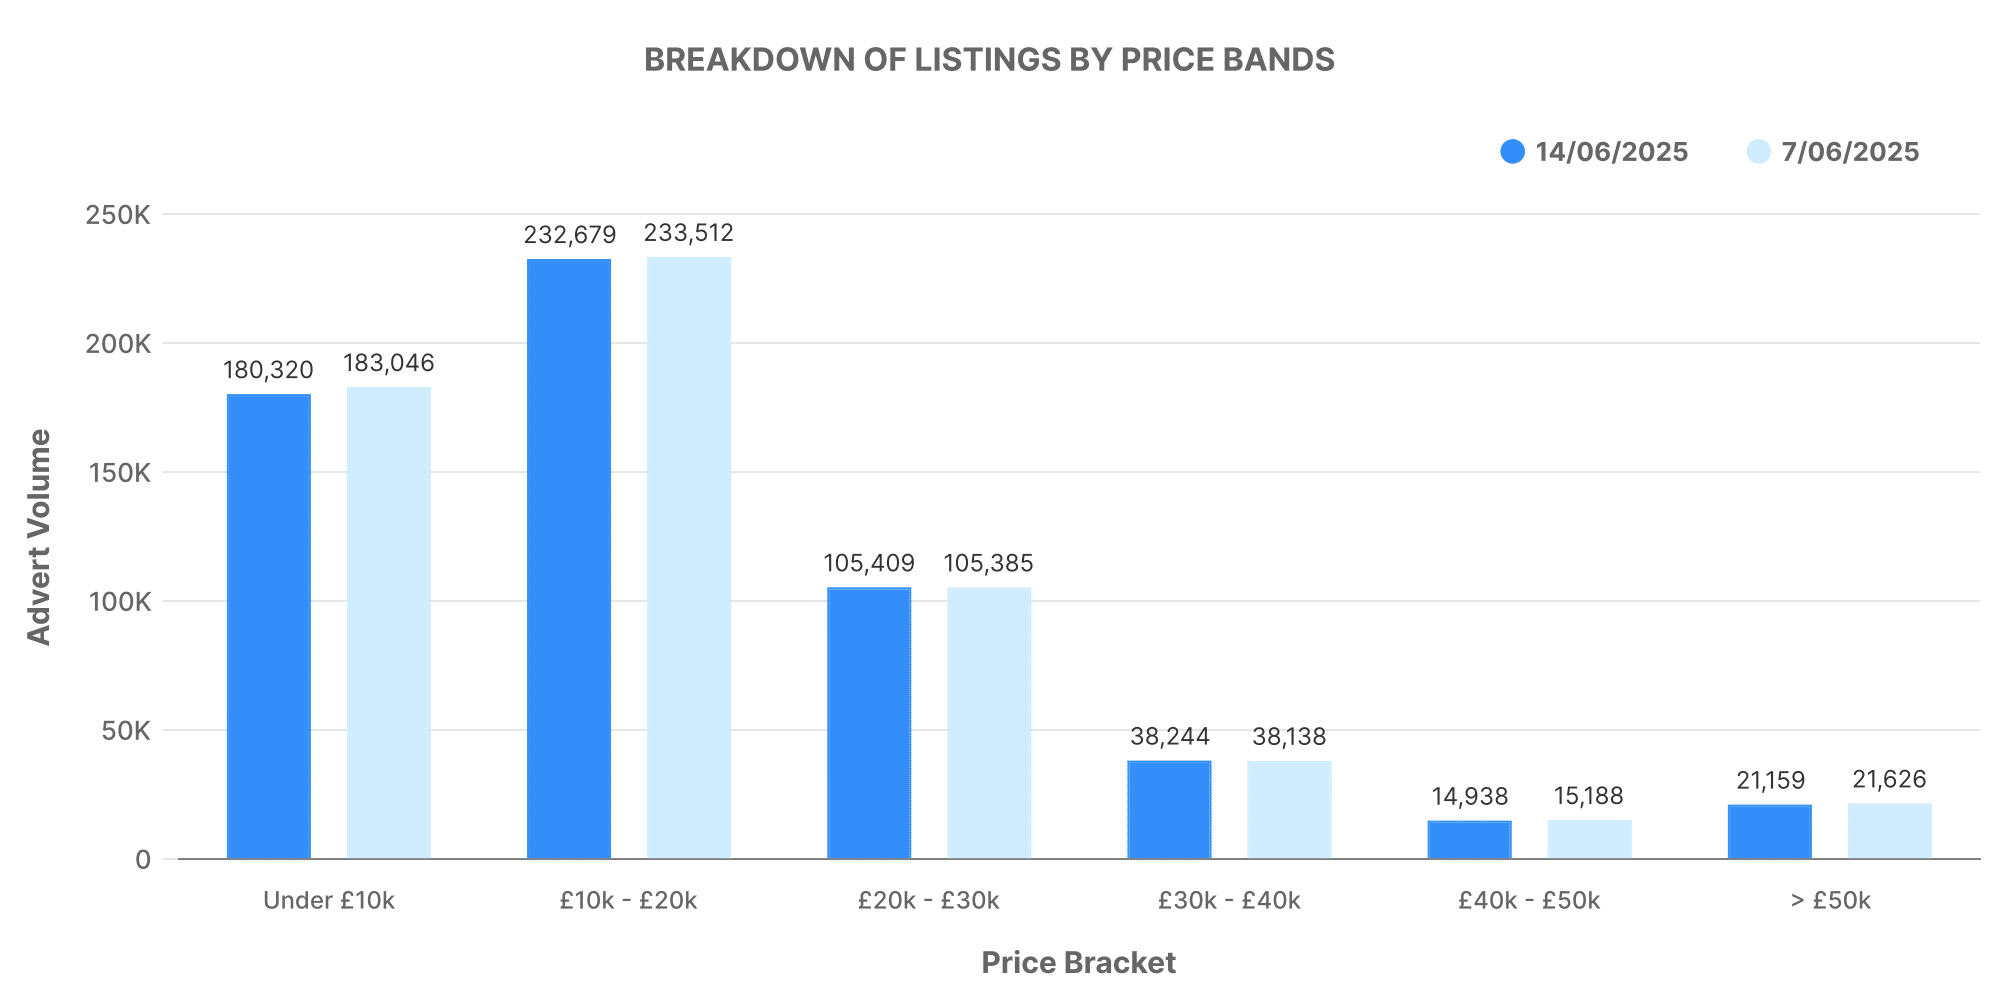
Looking at the price bands of ICE vehicles, a similar pattern repeats itself. Most cars were in the £10,000 – £20,000 range, however, the average price of these vehicles (£18,703) was considerately lower compared to their electric counterparts (£26,275).
A Closer Look at Dealer Volume
Analysing dealer volumes can further enhance our understanding of the market conditions.
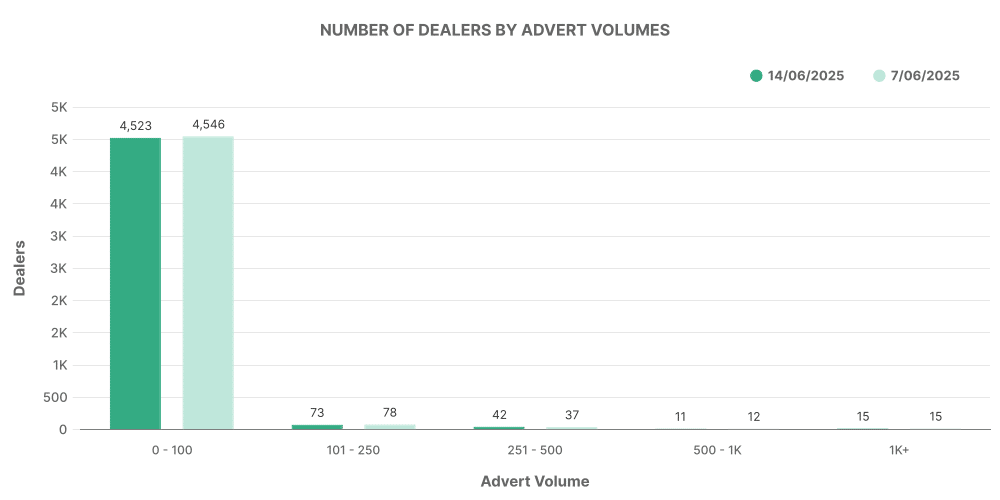
For EVs, the majority of dealers listed between 0-100 vehicles, evidencing the still nascent stage of this market in comparison to ICE vehicles.
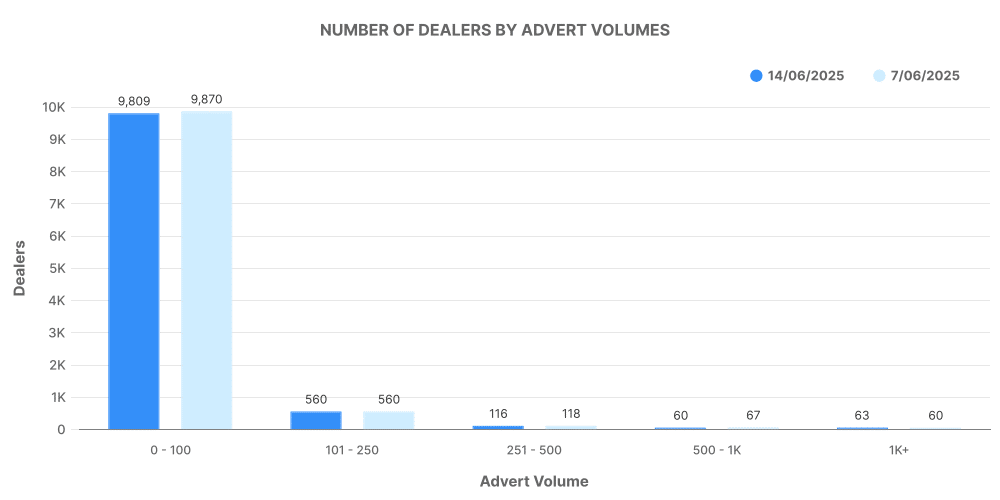
In contrast, ICE vehicle listing volumes were more dispersed among dealers, showing the deeply rooted status of this market with established dealerships of various size participating.
The Top 100 Dealers: ICE vs EV
This section provides an analysis of the top 100 dealerships by listing volume for both EVs and ICE vehicles.
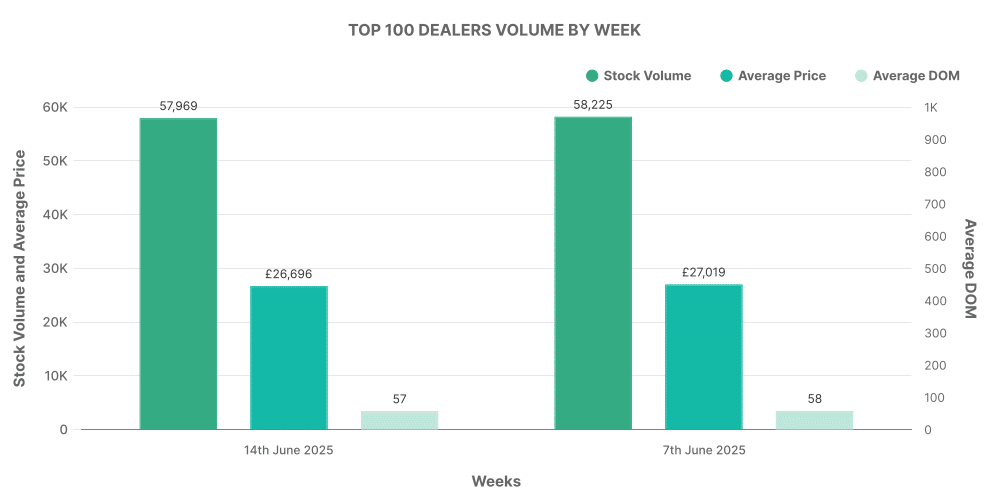
The top 100 dealers contributed to 16.08% of the total EV listings, with vehicles displaying an above-average price for the market.
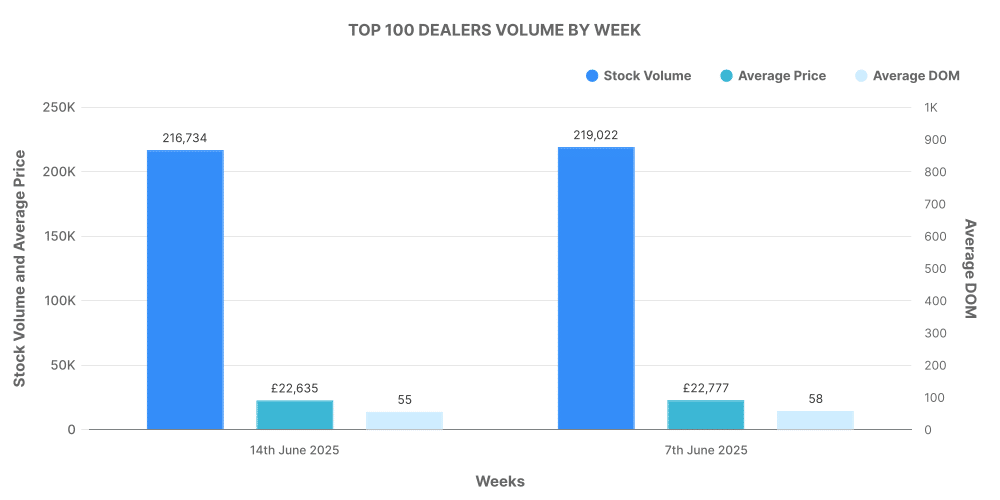
On the other hand, the top 100 ICE dealerships were responsible for 14.16% of total listings. Similar to their EV counterparts, they were selling vehicles at a higher than average market price.
Comparison: ICE vs EV
The ICE car market caters to a wider audience and has a greater number of listings, due to its longstanding reputation and a larger pool of available stock. On the flip side, the used EV market is expanding rapidly, evidenced by increasing listing numbers and wider price ranges.
The average listing price for used EVs (£26,275) comfortably surpasses the average ICE car price (£18,703), suggesting a premium positioning for electric vehicles in the used car market.
