Introduction
Delve into our latest analysis of the UK’s used electric car market for the week ending on 10th February 2024. This report presents key insights into dealer activities, advertisement numbers, price revisions, and market trends. With the electric vehicle (EV) market evolving rapidly, understanding these dynamics is crucial for dealers aiming to navigate this sector effectively, investors keeping an eye on growth opportunities, and consumers looking for the best deals on electric cars. Our analysis covers everything from changes in the number of dealers and rooftops to detailed observations on pricing strategies and the pace of sales, offering a comprehensive overview of the market’s current state.
Key Points
- The total number of dealers and advert numbers saw a minor increase from 3rd to 10th February, 2024.
- There was also a decrease in the number of rooftops and Days on Market (DoM) Average during the same period.
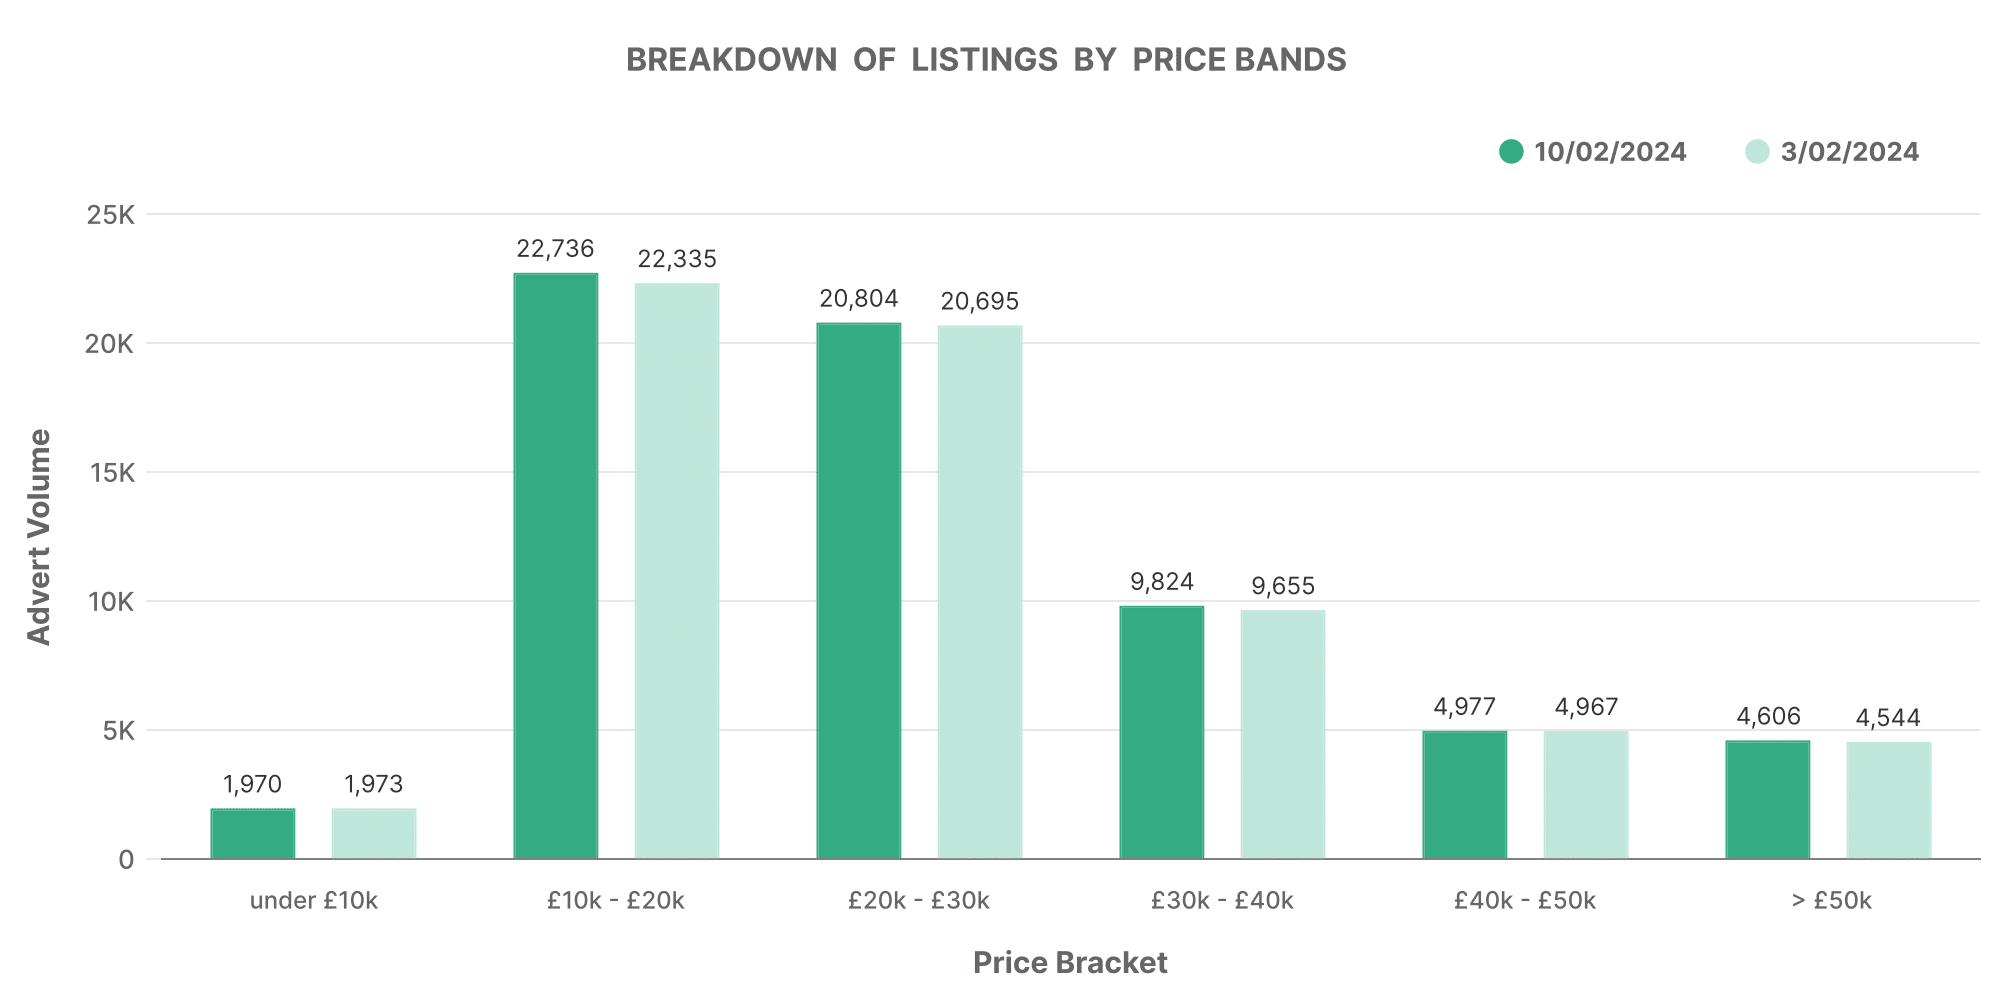
- The breakdown of listings indicates the highest volume of adverts were in the £10,001-£20,000 and £20,001-30,000 bands.
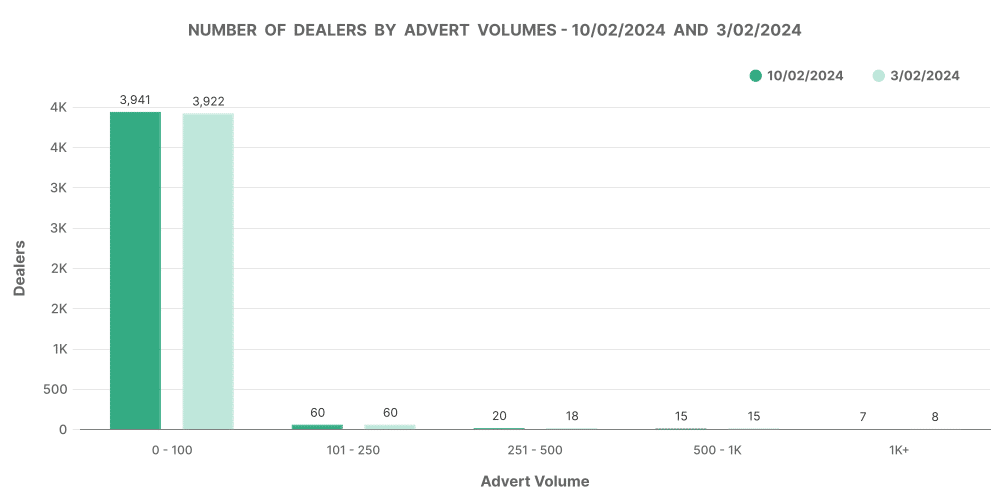
- The majority of dealers fall into the lower volume categories of having less than 100 and 101-250 adverts.
- Price revision data shows increases and decreases in advert prices, with far more decreases than increases.
Total Market Analysis
From 3rd February to 10th February 2024, there was a minor rise in the total number of dealers from 4,133 to 4,143. Interestingly, the total number of rooftops saw a slight decrease during this period, from 7,238 to 7,178. The total number of adverts increased from 114,410 to 118,311.
Days on Market (DoM) Average
The DoM average, a key indicator of how long it takes for an electric car to sell, also improved marginally from 74 days to 72 days. It shows a competitive and active market where cars are selling slightly faster.
Breakdown of Listings by Price Bands
The majority of car listings fell within the price bands of £10,001-£20,000 and £20,001-£30,000. The volume in these bands increased over the week slightly. There were also minor increases in the £30,001-£40,000, £40,001-£50,000 and over £50,000 bands.

Number of Dealers by Advert Volumes
The majority of dealers fall into the lower volume categories of having less than 100 and 101-250 adverts. Only fewer dealers have greater than 250 adverts, indicating higher capitalisation and more diversified portfolios.

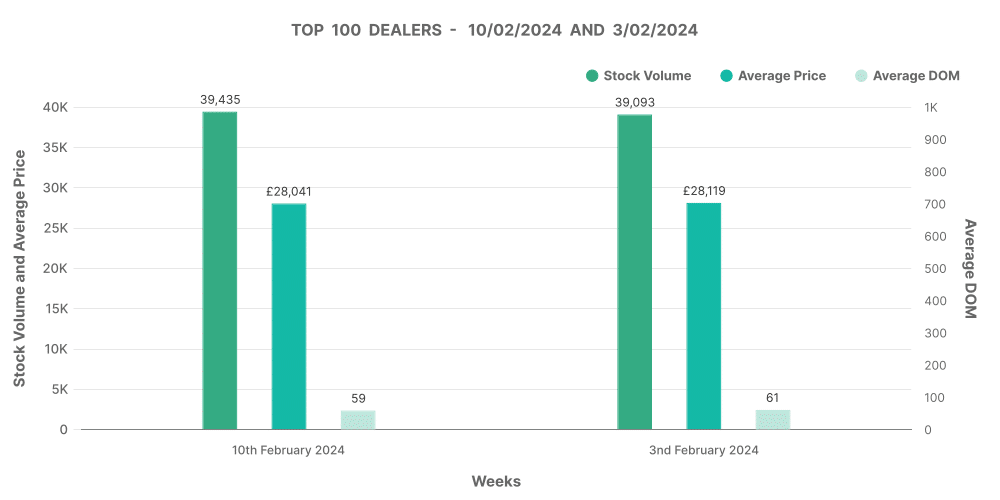
Analysis of Top 100 Dealers by Volume
Brief analysis of the dealers in the top 100 by volume shows minor increases in stock volumes but a slight decrease in the average price. The DoM for these top 100 dealers also decreased, which may be indicative of their ads being more appealing or competitive.

Price Revision Data
Notably, the data shows a higher number of decreases in advert prices than increases, with increases going from 2,180 to 2,856 and decreases going from 13,270 to 13,950 over the one week period.
Conclusion
In conclusion, the data indicates a modest increase in active dealers and in the volume of adverts. Competitive pricing and market activity are implied by the reduction in DoM averages and the changes in advert prices.
Next week: 17th February | Previous week: 3rd February
