Marketcheck, the UK’s most significant source of data on the UK used car market, has today published figures on trends within the used E vans sector.
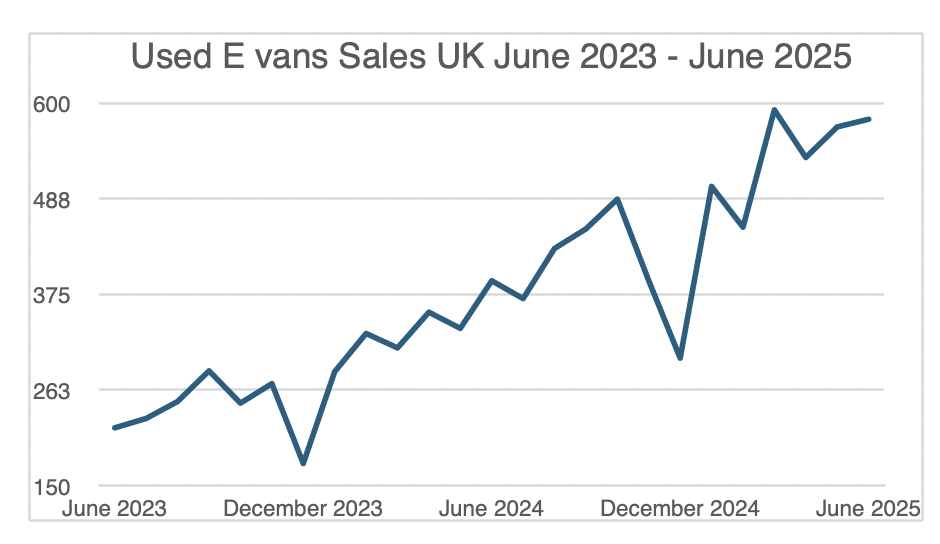
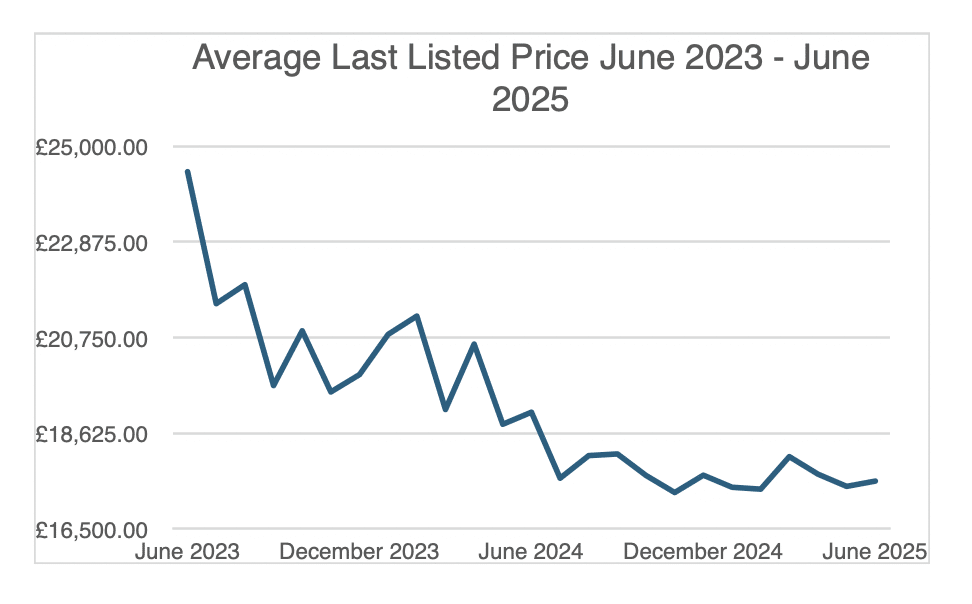
Over a period of two years (between June 2023 and June 2025), Marketcheck found that sales have doubled, and the average last listed price has fallen by almost a third.

In June 2023, 218 used EV vans were sold across the UK. By June 2025, this rose by 166.51%, more than doubling to 581.

Marketcheck also found a significant decrease in the cost of a used EV van. Last month the average last listed price for a used E van in the UK was £17,560.42. This is a 28.14% decrease when compared with the last listed price in June 2023, when the average used E van cost £24,435.61. This is a decrease of £6,875.19.
The analysis conducted by Marketcheck shows that the cost of a used E van appears to have reached its market level. In the first half of the analysis (between June 2023 and June 2024), the average last listed price fell by £5,344.24, a 21.87% decrease. Between June 2024 and June 2025, the price decrease was less steep, falling by 8.02%, or £1,530.95.
In 2025, the average last listed price fluctuated from a high of £18,103.78 to a low of £17,380.95, indicating that the cost has plateaued.
Alastair Campbell, Marketcheck UK commented:
“The used electric van market has undergone a major transformation over the past two years. With average prices down by nearly a third and sales more than doubling, it’s clear that these vehicles are now a far more accessible option for businesses and sole traders looking to make the switch to electric.
Our analysis suggests the market has now reached a stable pricing point, with values holding relatively steady throughout 2025. As demand continues to grow and prices level out, used E vans are increasingly becoming a practical and cost-effective solution for fleets and commercial users alike.”
ENDS
Notes to Editor:
| Used EV Vans | ||
|---|---|---|
| Month | Volume of Sold | Average Last Listed Price |
| June 2023 | 218 | £24,435.61 |
| July 2023 | 229 | £21,503.31 |
| August 2023 | 249 | £21,924.77 |
| September 2023 | 285 | £19,683.40 |
| October 2023 | 247 | £20,900.12 |
| November 2023 | 270 | £19,541.74 |
| December 2023 | 176 | £19,927.02 |
| January 2024 | 284 | £20,821.00 |
| February 2024 | 329 | £21,227.11 |
| March 2024 | 312 | £19,151.61 |
| April 2024 | 354 | £20,604.34 |
| May 2024 | 335 | £18,823.70 |
| June 2024 | 391 | £19,091.37 |
| July 2024 | 370 | £17,624.50 |
| August 2024 | 429 | £18,126.85 |
| September 2024 | 452 | £18,163.80 |
| October 2024 | 487 | £17,684.94 |
| November 2024 | 391 | £17,306.55 |
| December 2024 | 300 | £17,691.37 |
| January 2025 | 502 | £17,423.47 |
| February 2025 | 454 | £17,380.95 |
| March 2025 | 592 | £18,103.78 |
| April 2025 | 536 | £17,714.11 |
| May 2025 | 572 | £17,443.05 |
| June 2025 | 581 | £17,560.42 |
About Marketcheck:
We are the leading source of UK automotive data. We collate, enhance and manage more data on the UK used car sector than any other provider. For automotive businesses we bring unprecedented access to live data to power analysis, pricing, reporting and AI agents on the UK used car market.
We track over 650,000 cars and 11500 dealers across 16k locations daily.
Contact:
Alistair Harrison
[email protected]
