Key Points
- The total market saw a slight increase with dealers raising from 9,862 to 9,911 and rooftops from 13,344 to 13,624.
- The average price of a listing marginally increased from £18,915 to £18,987 while the average days in market increased by 1 day.
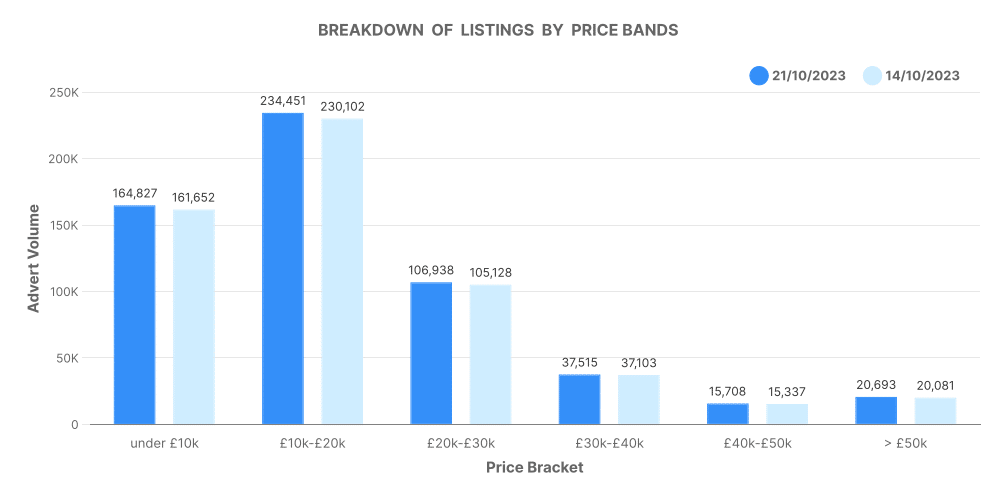
- The breakdown of listings by bands showed a slight increase across all price bands.
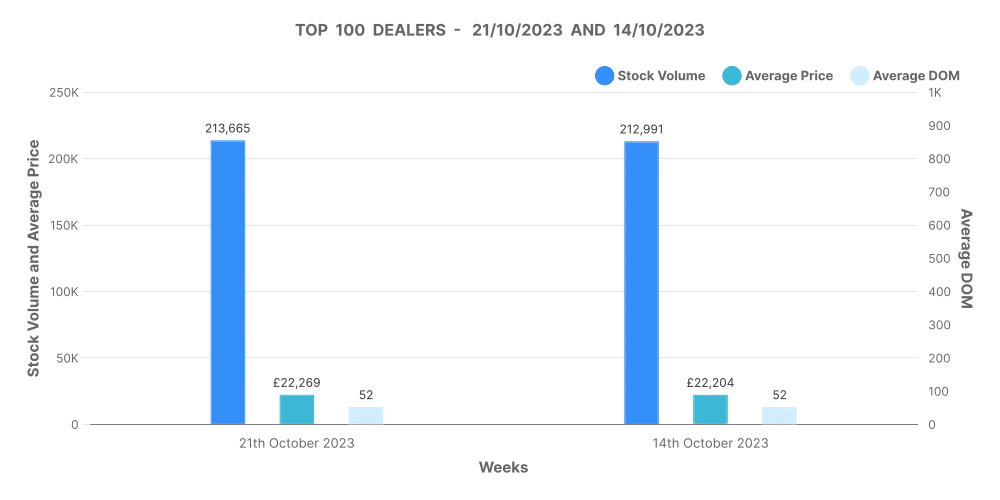
- Analysis of the dealers who make up the top 100 by volume showed that the stock volumes increased slightly. The average price saw a minor rise while the days on the market remained the same.
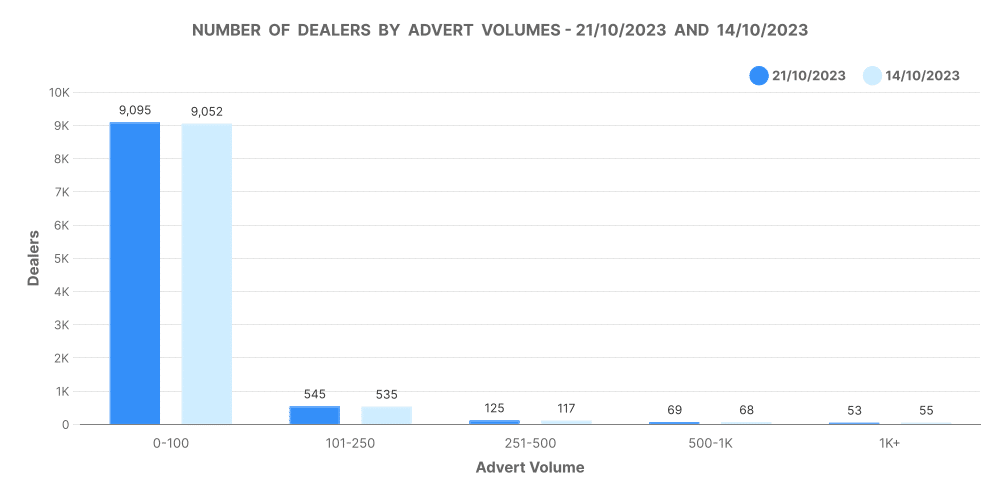
- The number of dealers by advert volumes was stagnant except in the 251 – 500 band which saw an increase of 8 dealers.
Total Market Analysis
The total market experienced marginal growth between the 14th and 21st of October, 2023. There was an addition of 49 dealers, elevating the total from 9,862 to 9,911. Concurrently, the total number of rooftops also ascended from 13,344 to 13,624.
Days on Market (DoM) Average
The average time a product stayed on the market rose from 74 days to 75 days within the same period. It’s a subtle indication of a slower market demand.
Breakdown of Listings by Price Bands
Within the duration, every price band experienced a slight uptick in listings. The band below £10,000 saw an increase of 3,175 listings, making it the band with the mostincrements. The detailed distribution of this increase can be seen in the presented chart.

Number of Dealers by Advert Volumes
The number of dealers advertising fewer than 100 adverts and those marketing between 100 to 250 products remained the same. However, there was an increase of 8 dealers in the 250 – 500 band. Thus, showing a higher level ofbuyer’s market. Here’s a depiction of this increase.

Analysis of Top 100 Dealers by Volume
An analysis of the top 100 dealers showed an additional 674 items to the stock volume. The price also slightly rose, whereas Days on Market (DOM) average remained constant. Here’s the graphical representation.

Price revision data – changes to advert prices
Within the one-week span, more prices were decreased (80,331) than increased (8,318). This could be attributed to the dealers’ attempt to stimulate sales in a slowing market.
Conclusion
In conclusion, while the market showed signs of a moderate slow-down with a higher DOM average and more price decreases, the market experienced marginal growth. However, the growth seems to be driven more by increases in the lower price bands, lower-volume dealers and an increased inventory amongst the top 100 dealers.
Next week: 28th October | Previous week: 14th October
