Days on market now hitting an average of 80 days, an ongoing slightly upward trend +5/6 days on late summer 2023.
Key Points
- The total number of dealers and rooftops slightly decreased and increased respectively from November to December 2023.
- The average listing price decreased marginally by £40 from November to December 2023.
- Days on Market (DoM) increased by 1 day over the period.
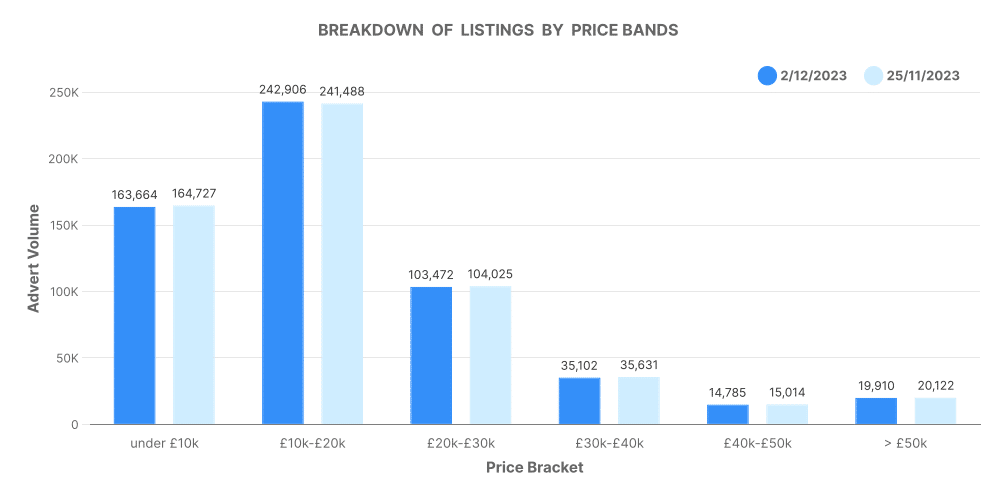
- Given the price bands, the proportion of listings showed a slight decrease in the extreme price bands and a minuscule increase in the middle bands between the two periods.
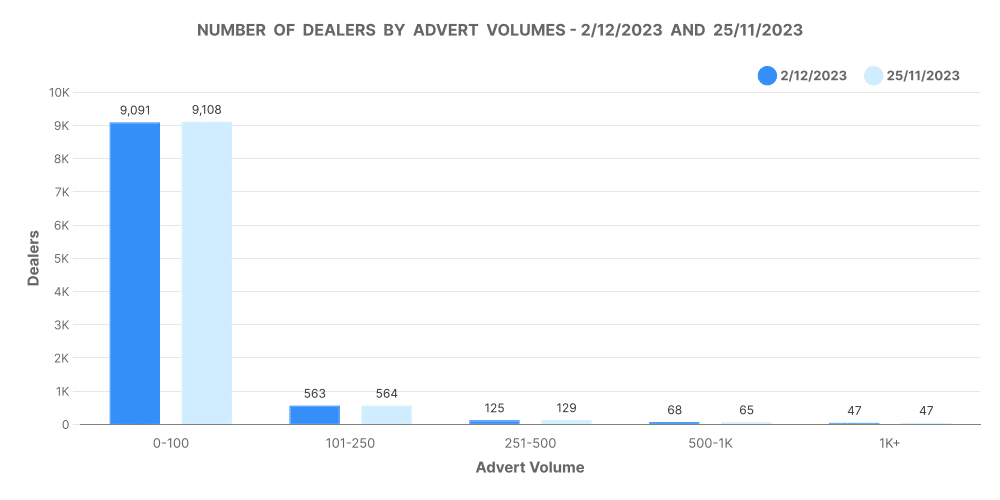
- Dealers who advertise less experienced a decline; However, those who advertise between 501 and 1000 had a slight increase.
Total Market Analysis
The total market analysis for November 25th – December 2nd 2023 shows a slight decrease in total dealers from 9,953 to 9,933, but an increase in the total number of rooftops from 13,777 to 13,822. This shift might be attributed to market fluctuations.
Days on Market (DoM) Average
Regarding the Days on Market (DoM) average, a slight increase from 81 to 82 days was observable over the period. This data highlights that the vehicles took one extra day on average to sell.
Breakdown of Listings by Price Bands
Analysis of listings by price bands indicates a slight downtrend for vehicles priced under £10,000 and over £50,000. However, listings priced between £10,001 and £40,000 show a marginal increase.

This image shows the distribution of vehicles across different price bands.
Number of Dealers by Advert Volumes
Examining the number of dealers by advert volumes brings forth interesting insights. A recession was experienced by dealers advertising fewer than 100 and 101-250 adverts, with a small upscale observed in the 501-1000 advert bracket.

The diagram demonstrates the number of dealers by advert volumes.
Analysis of Top 100 Dealers by Volume
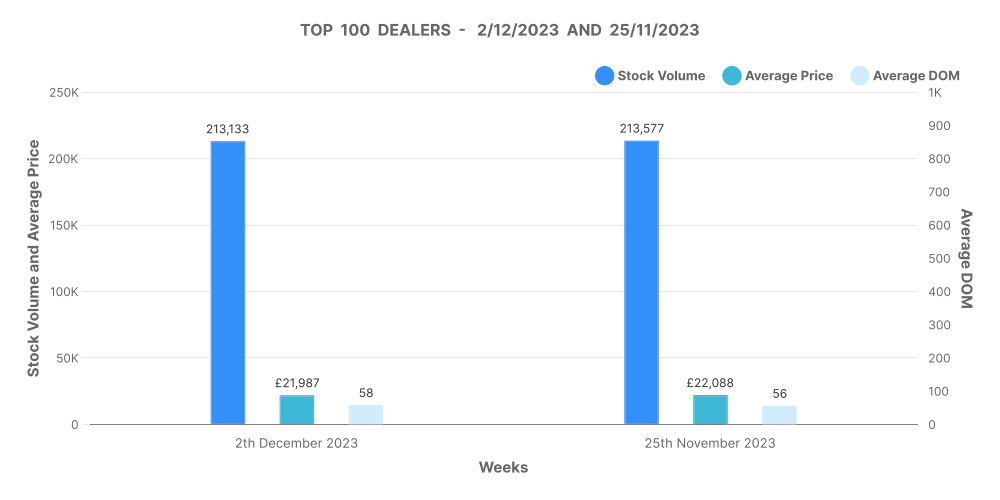
An analysis of the top 100 dealers by volume of stock showed their average price decreased from £22,088 to £21,987, and the DoM increased from 56 to 58 days.

This image analyzes the top 100 dealers by volume of stock.
Price Revision Data – Changes to Advert Prices
Comparing November to December 2023, advert prices showed an increase for 8,664 adverts, compared with a decrease for 76,595 adverts, suggesting a volatile market situation.
Conclusion
In conclusion, this analysis indicates a complex market scenario with slight fluctuations across different areas of the market. A comprehensive understanding of these trends can inform crucial business decisions.
Next week: 9th December | Previous week: 25th November
