Weekly Overview
The UK used car market remains a vibrant and competitive space. For the week ending 18th May 2024, the data reveals slight changes in key metrics, with important distinctions between ICE and EV sectors. This analysis covers overall market conditions, the breakdown of listings by price bands, and the performance of top dealers.
Internal Combustion Engine (ICE) Vehicles
For ICE vehicles, there was a modest increase in total listings, moving from 868,204 to 897,158, a rise of 3.3%. The average days on market (DOM) slightly increased to 82 days, indicating a steady market without significant fluctuations. The average price of ICE vehicles decreased marginally to £18,118.
Breakdown of Listings by Price Bands:
- 0-10K: Increased from 181,706 to 184,530
- 10-20K: Decreased from 226,521 to 225,765
- 20-30K: Remained stable at around 94,237
- 30-40K: Slight increase from 33,938 to 33,971
- 40-50K: Decreased from 14,604 to 14,463
- 50K+: Increased slightly from 19,218 to 19,234
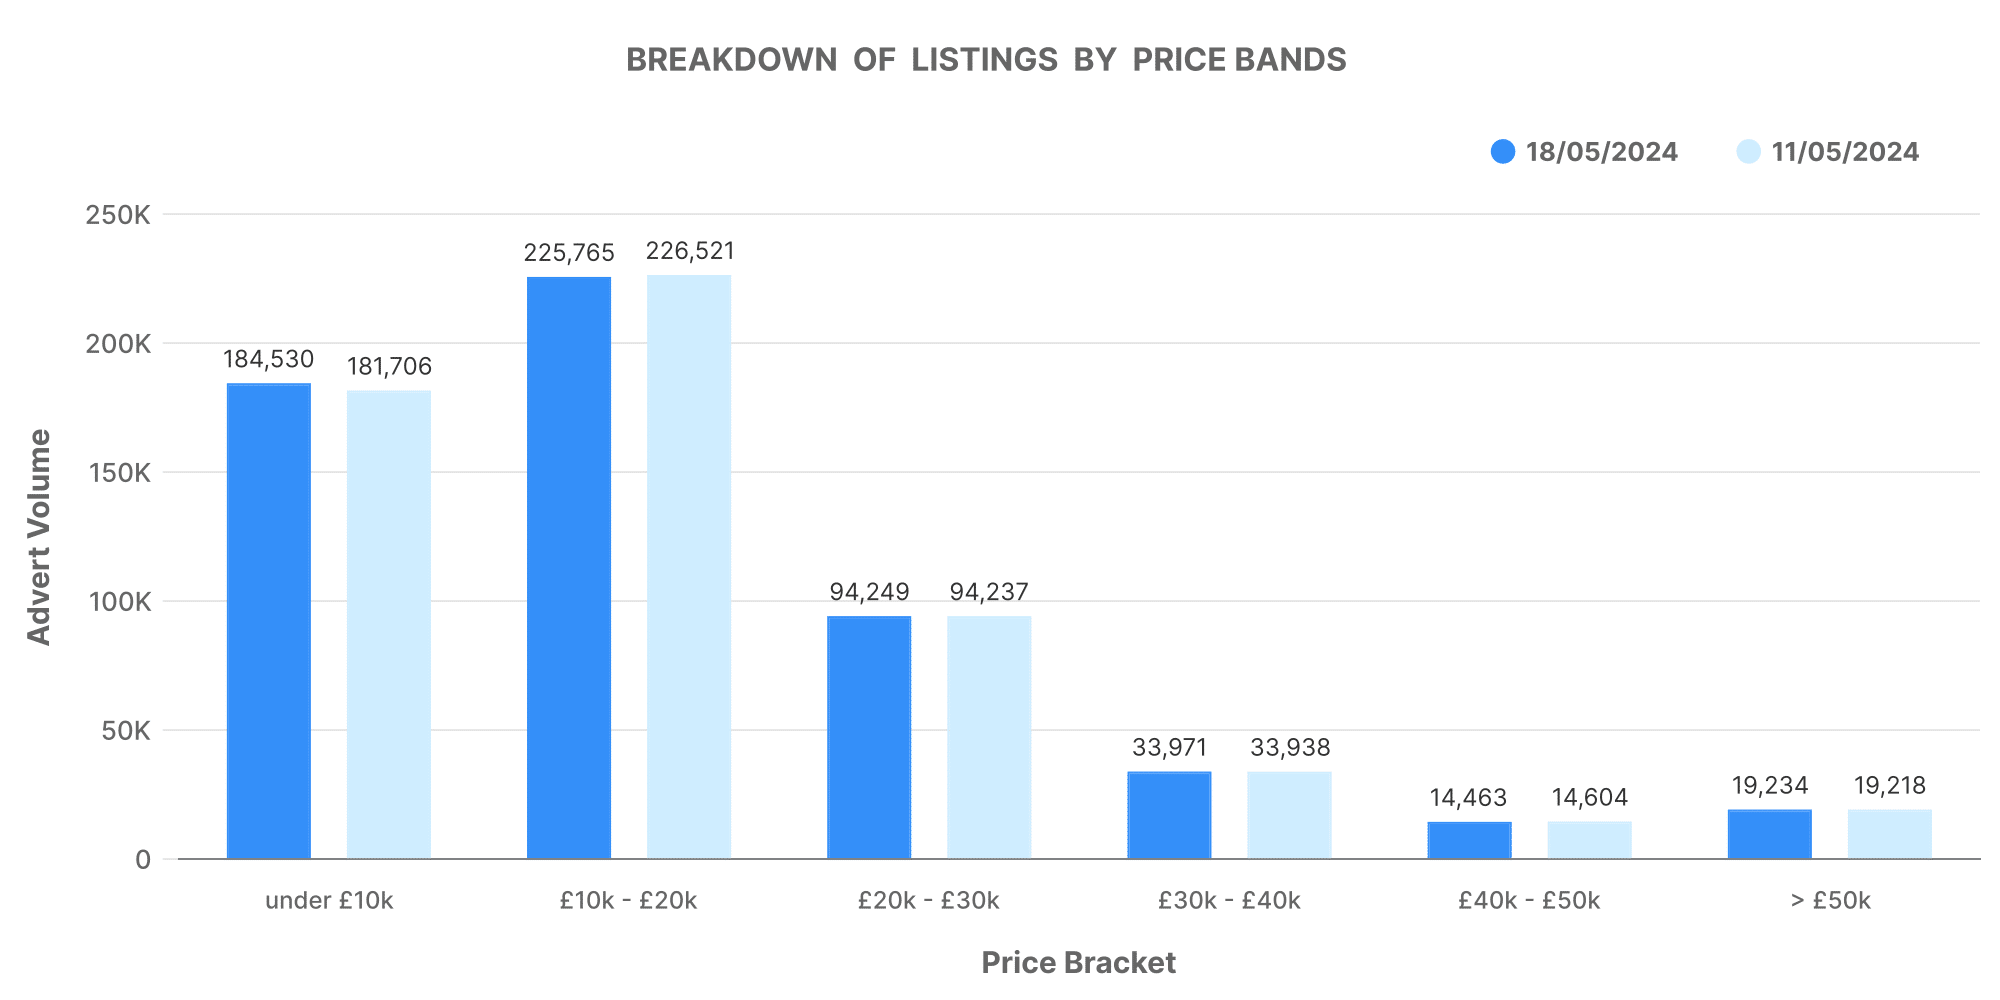
These changes reflect slight shifts in market segments, with a notable increase in the lowest and highest price bands.
Number of Dealers by Advert Volumes:
- 0-100 listings: Stable around 9,701
- 101-250 listings: Increased from 543 to 553
- 251-500 listings: Slight decrease from 118 to 113
- 500-1K listings: Increased from 64 to 71
- 1K+ listings: Decreased from 52 to 51
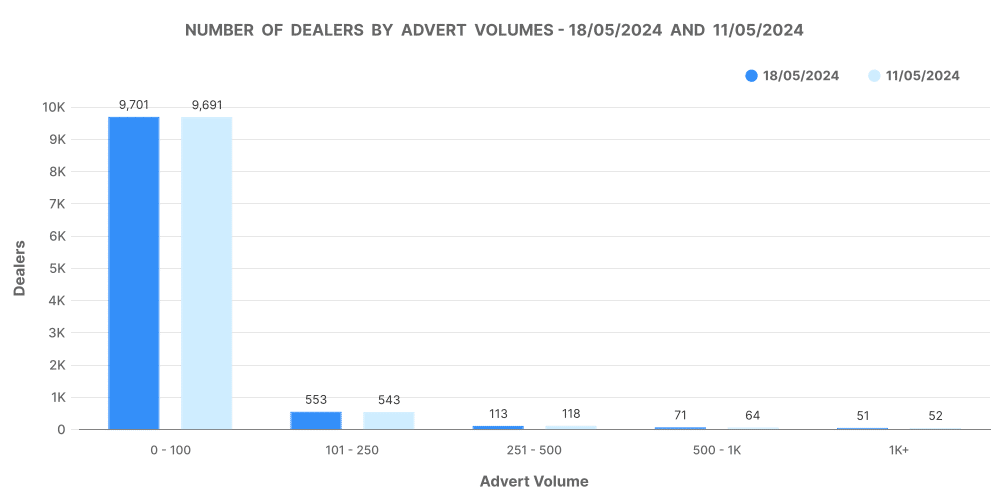
This indicates a small increase in dealers with moderate listing volumes, suggesting a competitive middle market.
Analysis of Top 100 Dealers by Volume:
- Stock volume: Slight decrease to 201,240
- Average DOM: Remained stable at 50 days
- Average price: Increased to £22,112
- Price increases: Slight increase to 11,793
- Price decreases: Increased to 75,557
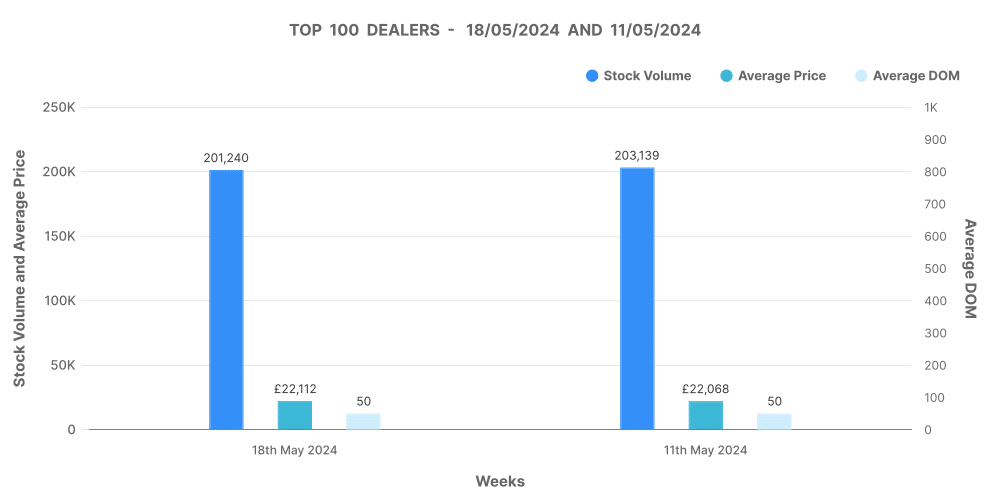
The data shows that the top 100 dealers have managed to maintain their market presence with stable DOM and an increase in average prices and price adjustments.
Electric Vehicles (EVs)
The EV market continues to grow, albeit with different dynamics compared to ICE vehicles. The total listings for EVs increased from 127,298 to 132,021, a rise of 3.7%. The average DOM for EVs increased slightly to 69 days, with the average price slightly decreasing to £27,655.
Breakdown of Listings by Price Bands:
- 0-10K: Increased from 2,642 to 2,748
- 10-20K: Slight increase from 25,350 to 25,410
- 20-30K: Decreased from 22,113 to 21,953
- 30-40K: Remained stable around 11,365
- 40-50K: Slight decrease from 5,225 to 5,129
- 50K+: Decreased from 4,891 to 4,877
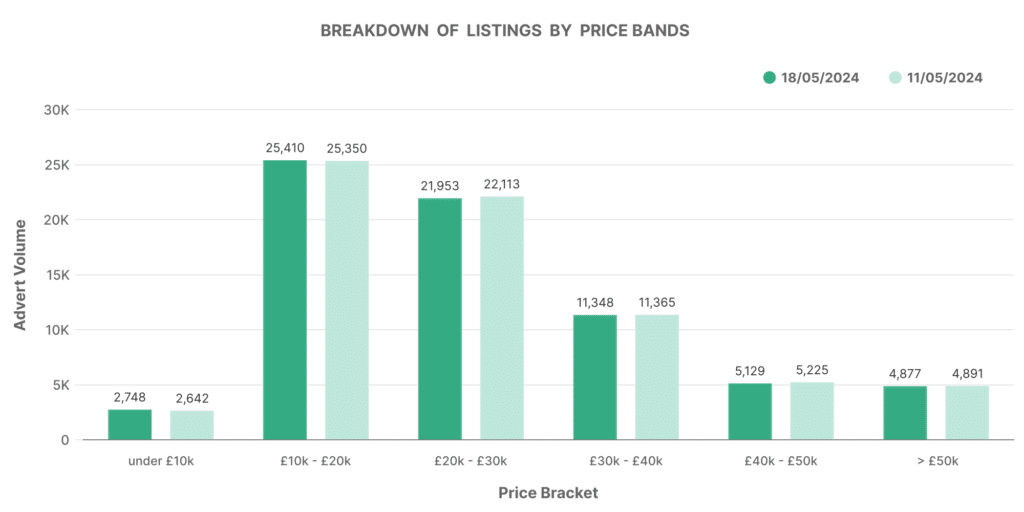
The data indicates a stable distribution across price bands with slight adjustments, particularly in the lower and middle segments.
Number of Dealers by Advert Volumes:
- 0-100 listings: Stable around 4,123
- 101-250 listings: Slight increase to 71
- 251-500 listings: Stable at 16
- 500-1K listings: Remained at 10
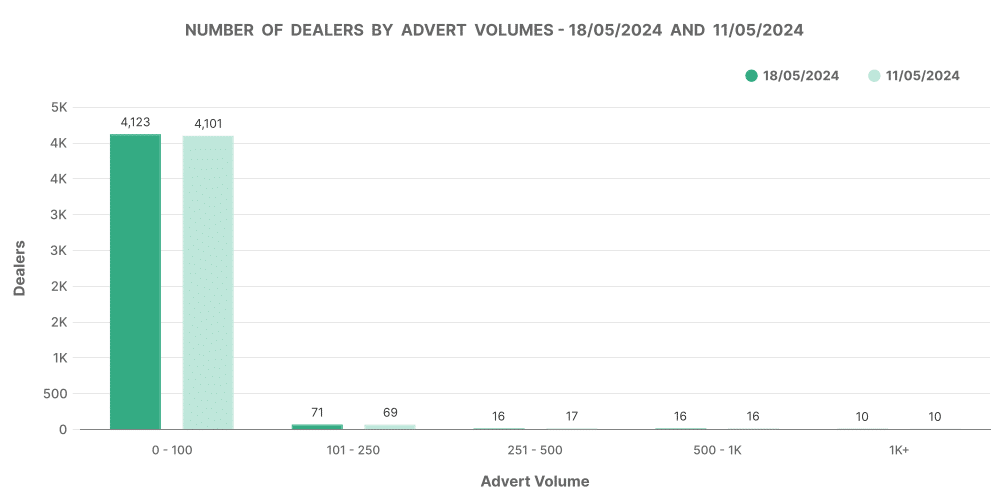
The dealer activity for EVs shows stability with a slight increase in moderate volume segments.
Analysis of Top 100 Dealers by Volume:
- Stock volume: Slight decrease to 44,457
- Average DOM: Increased to 55 days
- Average price: Slight decrease to £28,064
- Price increases: Decreased to 2,003
- Price decreases: Increased to 19,088
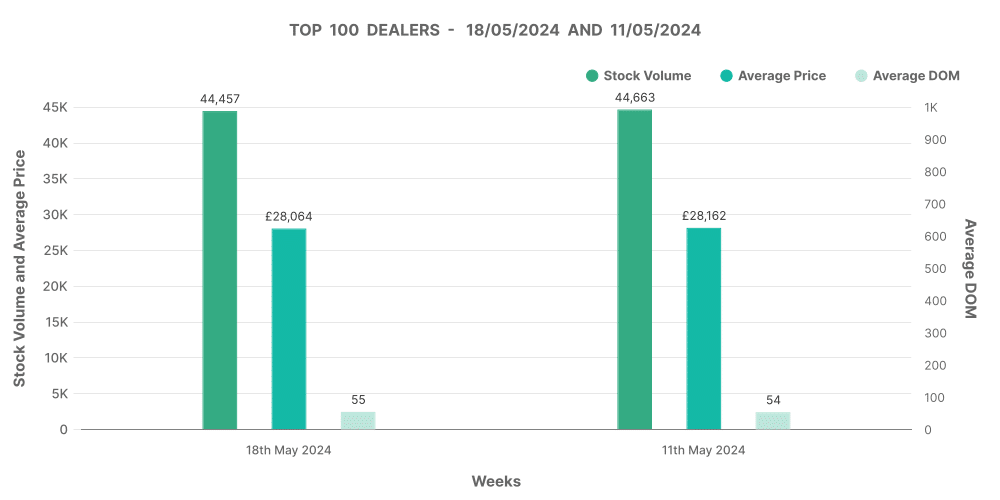
The top 100 dealers in the EV market have experienced a slight increase in DOM, indicating slower sales, with a corresponding adjustment in pricing strategies.
Comparing EVs to ICE Vehicles
EVs currently hold a 12.45% share of the used car market, a slight decrease from the previous week. In contrast, ICE vehicles dominate with an 87.55% share. The average price of EVs (£27,655) remains significantly higher than ICE vehicles (£18,118), reflecting their higher market value and consumer demand.
Price Trends:
- EVs: £27,655 (decrease from £27,729)
- ICE vehicles: £18,118 (decrease from £18,185)
This price disparity highlights the premium associated with EVs, although both markets show minor adjustments in average prices.
Marketcheck UK’s Relevance
Marketcheck UK provides invaluable insights for automotive dealers by offering comprehensive data on used car listings. Our platform enables dealers to:
- Analyse market trends with real-time data.
- Track average DOM and pricing strategies.
- Adjust inventory based on detailed breakdowns of listings by price bands.
- Stay informed about the performance of top dealers and market segments.
Using Marketcheck UK’s tools, dealers can optimise their purchasing and selling strategies, ensuring they remain competitive in a dynamic market.
