The UK used car market continues to showcase its dynamic nature, with both Internal Combustion Engine (ICE) vehicles and Electric Vehicles (EVs) making significant contributions. This report provides insights into the latest trends observed during the week ending 31st August 2024, focusing on key metrics such as dealer participation, average days on market, price trends, and inventory volumes. By analysing these aspects, automotive dealers can gain a clearer understanding of the current market conditions and adjust their strategies accordingly.
ICE Vehicle Market Overview
The ICE vehicle market remains the dominant force in the UK used car sector, with over 85% of listings attributed to non-electric vehicles. However, the week ending 31st August 2024 saw a slight decline in total listings, dropping from 898,791 in the previous week to 853,632. This represents a 5% decrease, suggesting a potential tightening of inventory among ICE vehicles.
- Average Days on Market: The average days on market (DOM) for ICE vehicles increased marginally from 85 to 87 days. While this is a relatively minor shift, it could indicate a slight cooling in buyer interest or possible overpricing within certain price bands.
- Average Price: The average price of ICE vehicles saw a slight decrease from £17,967 to £17,895, reflecting the market’s sensitivity to economic factors and the fluctuating supply-demand balance.
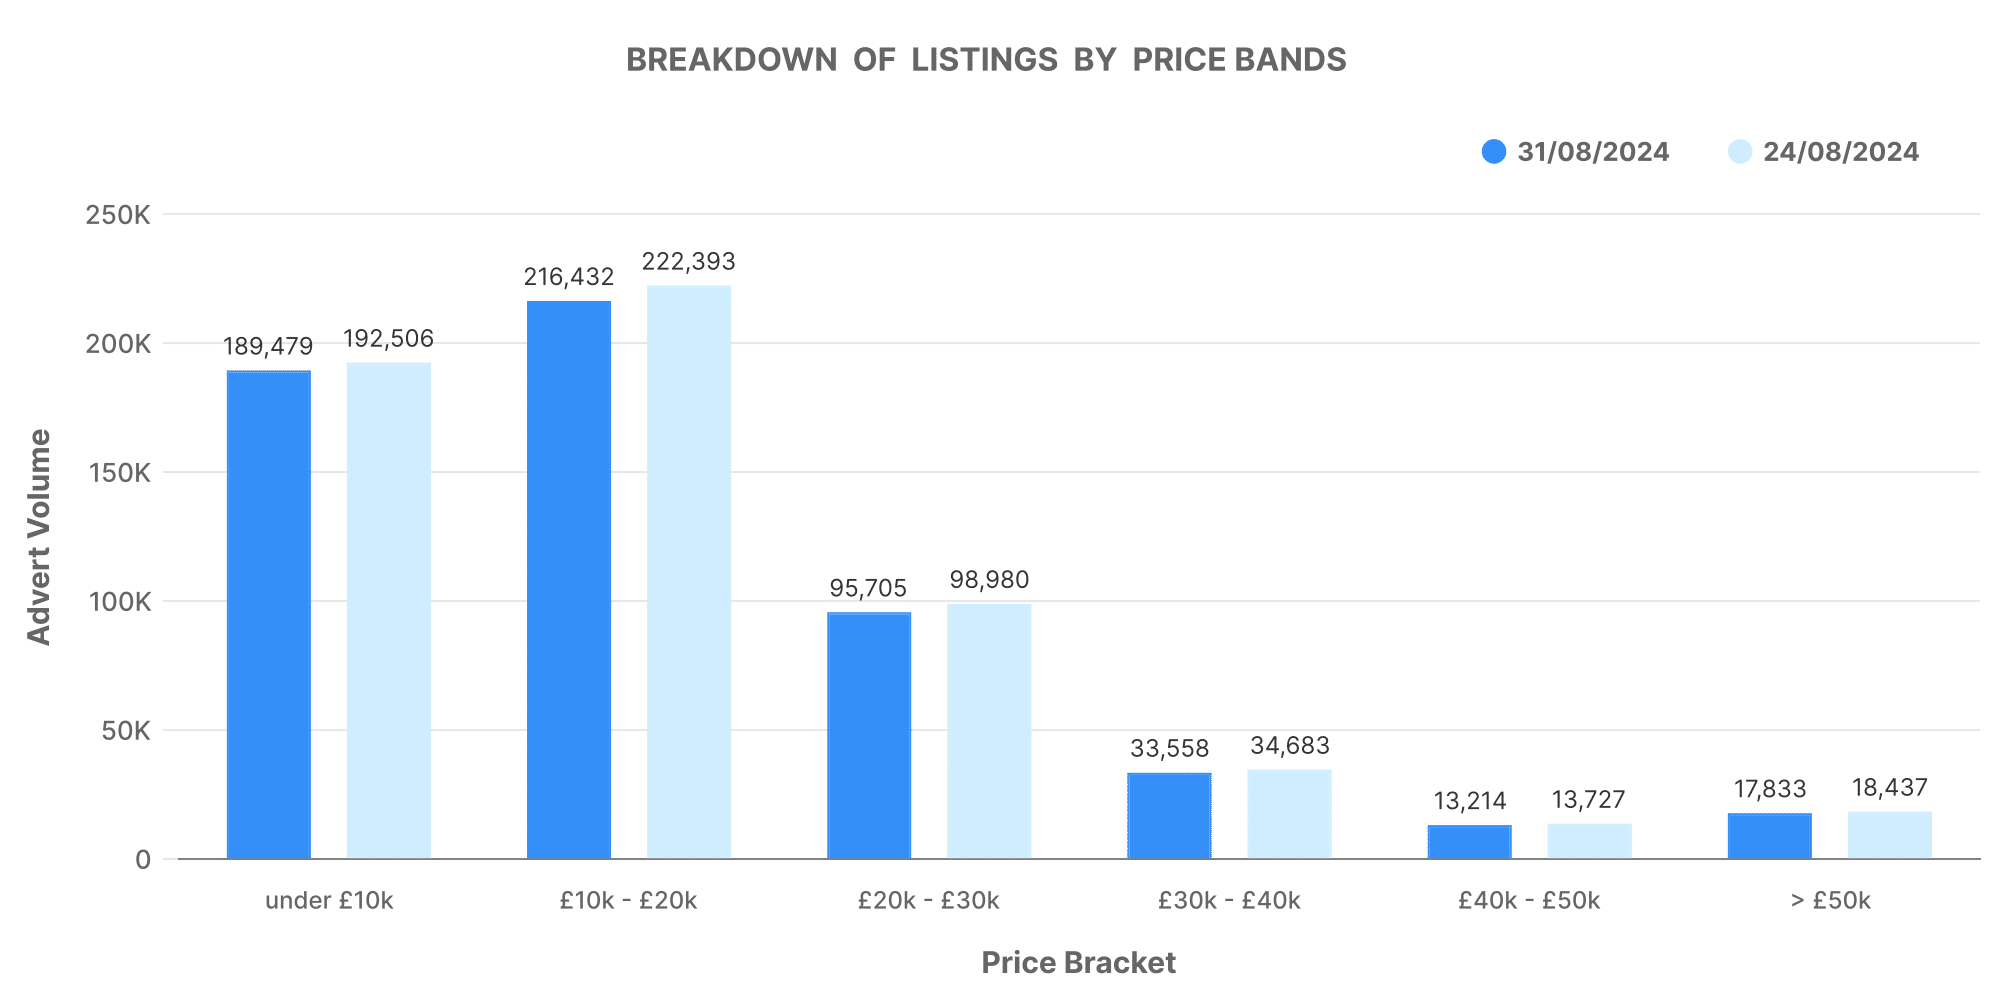
- Price Band Analysis: The distribution of vehicles across different price bands remained consistent, with the majority falling within the £10,000-£20,000 range. Notably, the highest percentage of ICE vehicles listed were within the £10,000-£20,000 bracket, emphasising the continued demand for mid-range vehicles.
Dealer Participation and Inventory Levels
- Dealer Count: The total number of dealers listing ICE vehicles dropped slightly from 10,734 to 10,710, indicating a marginal reduction in dealer activity. This could be due to various factors, including seasonal adjustments or inventory constraints.
- Inventory Volumes: There was a notable reduction in inventory volumes, particularly within the larger inventory bands. Dealers with inventories of 500-1,000 vehicles decreased from 52 to 48, and those with over 1,000 vehicles dropped from 59 to 54. This trend could suggest that larger dealerships are consolidating their stock or experiencing higher turnover rates.
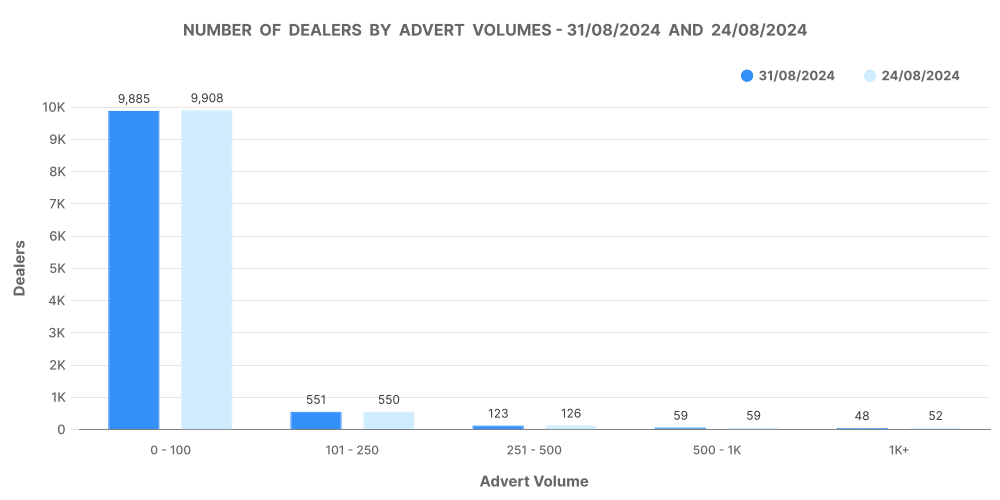
Breakdown of Listings by Price Bands
The price band distribution of ICE vehicles reveals key insights into consumer preferences and dealer strategies:
- £0-£10K: This segment accounted for a significant portion of the market, with 189,479 listings, reflecting a continued demand for affordable used cars.
- £10-£20K: The largest segment, with 216,432 listings, remains strong, indicating that mid-range vehicles continue to be the most popular choice among buyers.
- £50K+: Although this category represents a smaller portion of the market, the luxury vehicle segment still holds steady, with 17,833 listings.
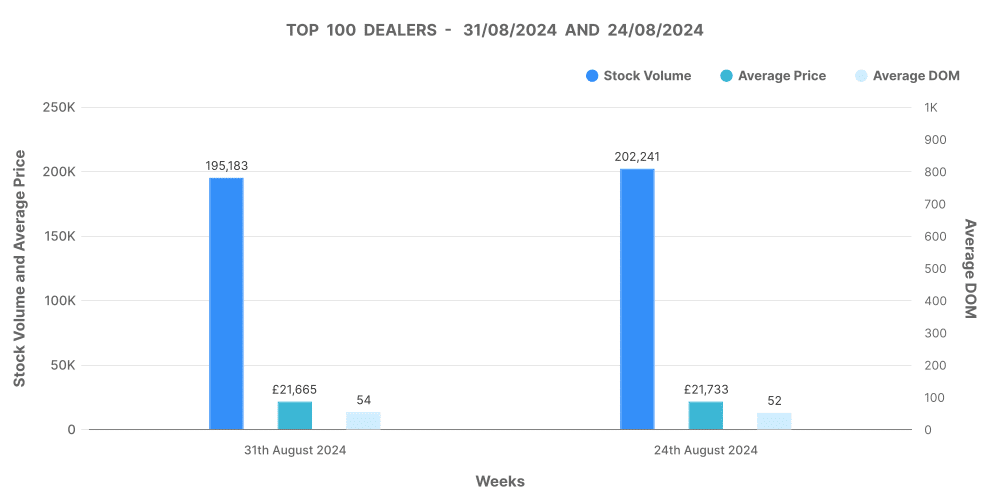
Performance of Top 100 Dealers
- Top 100 Stock Volume: The top 100 dealers continue to maintain a substantial presence, though their stock volumes decreased slightly from 202,241 to 195,183 vehicles.
- Average DOM and Price: The average days on market for the top 100 dealers increased marginally to 54 days, while the average price remained relatively stable at £21,665.
- Price Adjustments: Price decreases among the top 100 dealers were more common than increases, with 59,400 price reductions compared to 16,854 increases. This suggests that dealers are adjusting prices to stay competitive in a slightly softening market.
EV Market Overview
The electric vehicle market, though still smaller in comparison to ICE vehicles, continues to gain traction. EVs now represent just over 12% of the total used car listings, indicating a growing interest among both consumers and dealers.
- Total Listings: The number of EV listings decreased from 130,465 to 119,100, representing an 8.7% reduction. This could be attributed to seasonal fluctuations or a temporary dip in supply.
- Average DOM and Price: The average days on market for EVs increased slightly from 69 to 71 days, indicating a marginal slowdown in sales velocity. The average price of EVs also saw a slight decrease from £27,111 to £27,044, which remains significantly higher than the average price of ICE vehicles.
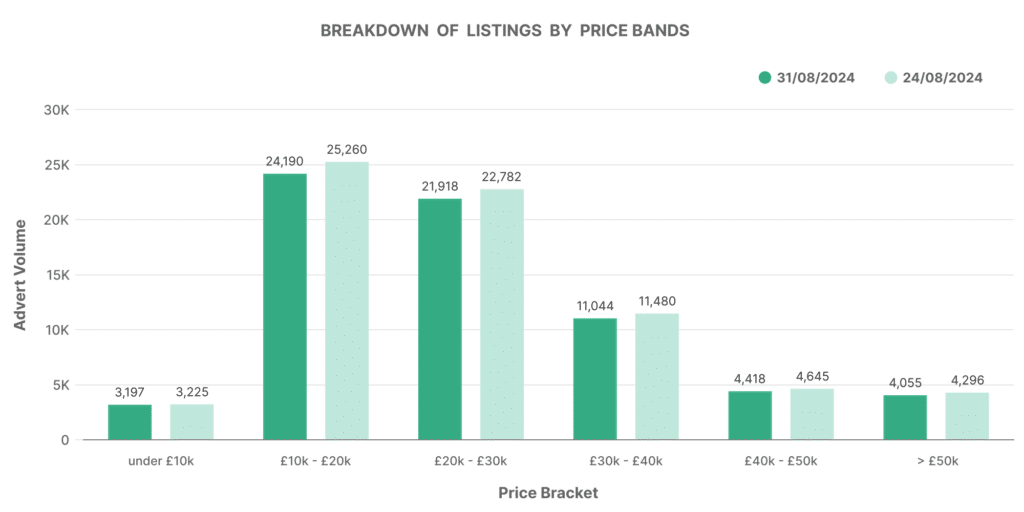
- Price Band Analysis: The £20,000-£30,000 price band continues to dominate the EV market, with 24,190 vehicles listed, followed closely by the £10,000-£20,000 band with 21,918 vehicles. The high average price of EVs suggests that they are still perceived as premium options in the used car market.
Dealer Participation and Inventory Levels in the EV Market
- Dealer Count: The number of dealers specialising in EVs remained stable, with only a slight decrease from 4,407 to 4,404.
- Inventory Volumes: Similar to the ICE market, larger inventory bands saw slight reductions. The most significant drop was in the 500-1,000 inventory band, which fell from 72 to 66. This indicates a potential consolidation of stock or increased sales turnover in larger EV dealerships.
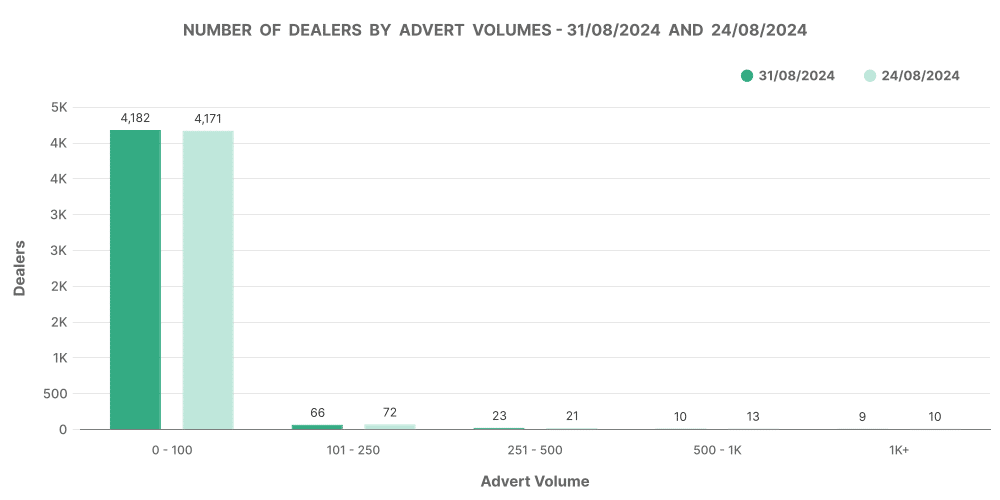
Breakdown of EV Listings by Price Bands
The EV market shows a more varied distribution across price bands compared to ICE vehicles:
- £0-£10K: A relatively small portion of the market, with 3,197 listings, reflecting the limited availability of budget EVs.
- £20K-£30K: The largest segment, with 24,190 listings, highlighting the demand for mid-range EVs.
- £50K+: The luxury EV market remains strong, with 4,418 listings, indicating a continued interest in high-end electric vehicles.
Performance of Top 100 EV Dealers
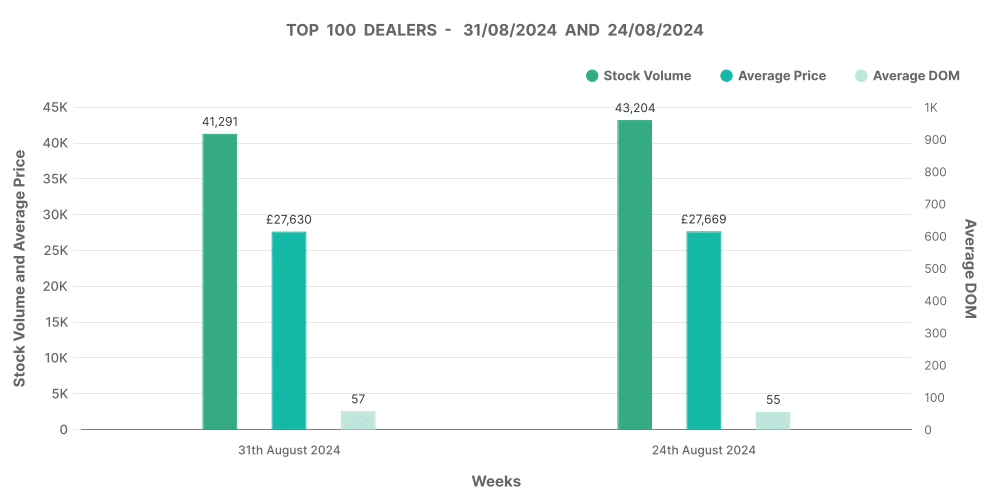
- Top 100 Stock Volume: The top 100 EV dealers also saw a decrease in stock volume, dropping from 43,204 to 41,291 vehicles.
- Average DOM and Price: The average days on market for the top 100 EV dealers increased slightly to 57 days, while the average price remained stable at £27,630.
- Price Adjustments: Similar to the ICE market, price decreases were more frequent, with 11,496 reductions compared to 3,175 increases, suggesting dealers are keen to move their EV stock.
Comparing ICE and EV Market Dynamics
The comparison between ICE and EV markets highlights some interesting contrasts and trends:
- Market Share: EVs now make up 12.08% of the used car market, slightly down from the previous week’s 12.29%. While still a minority, this share reflects the growing importance of EVs in the automotive sector.
- Average Price Comparison: The average price of EVs (£27,044) remains significantly higher than that of ICE vehicles (£17,895). This price gap underscores the premium associated with electric vehicles, though it may also pose a challenge for wider adoption among budget-conscious buyers.
- Days on Market: EVs are selling slightly faster than ICE vehicles, with an average DOM of 71 days compared to 87 days for ICE vehicles. This could indicate stronger demand or more competitive pricing strategies in the EV market.
Analysis of Top 100 Dealers by Volume
Both ICE and EV top dealers saw reductions in stock volumes, with the top 100 ICE dealers holding 195,183 vehicles and the top 100 EV dealers holding 41,291 vehicles. However, EVs continue to command higher average prices and slightly shorter DOM, reflecting their premium market position and growing appeal among consumers.
Conclusion
With our comprehensive data feeds, APIs, and analytical tools, Marketcheck UK is uniquely positioned to support dealers in maximising their opportunities in both the ICE and EV markets. Whether you’re looking to fine-tune your pricing strategy or understand the latest market trends, our solutions are designed to give you the edge in this fast-evolving landscape.
Next week: 7th September | Previous week: 24th August
