Understanding shifts in the used car market helps automotive businesses refine their strategies. This report analyses Marketcheck UK’s latest data on the used car market, covering internal combustion engine (ICE) and electric vehicle (EV) listings.
ICE Used Car Market Overview
November saw 819,854 used ICE cars listed across 10,680 dealers and 15,159 rooftops. The average days on market (DOM) for these vehicles increased slightly to 79 days, with an average price of £17,949.
Breakdown of Listings by Price Bands
- £0 – £10,000: 253,543 listings
- £10,000 – £20,000: 315,674 listings
- £20,000 – £30,000: 144,533 listings
- £30,000 – £40,000: 47,906 listings
- £40,000 – £50,000: 18,076 listings
- £50,000+: 23,578 listings
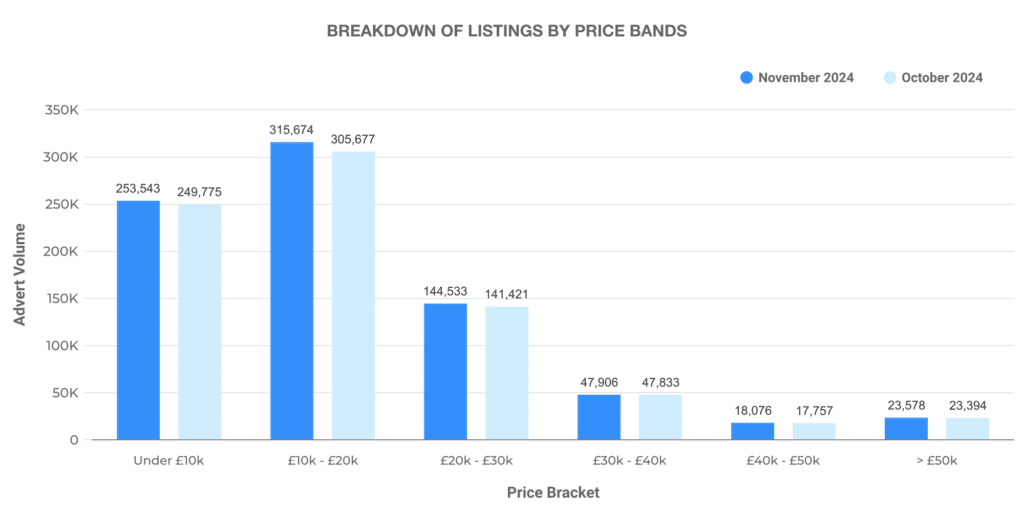
Most vehicles fell into the £10,000 – £20,000 range, making up 38.5% of the market, followed by the £0 – £10,000 band at 30.9%.
Number of Dealers by Advert Volumes
- 0 – 100 vehicles: 9,413 dealers
- 101 – 250 vehicles: 901 dealers
- 251 – 500 vehicles: 168 dealers
- 500 – 1,000 vehicles: 82 dealers
- 1,000+ vehicles: 83 dealers
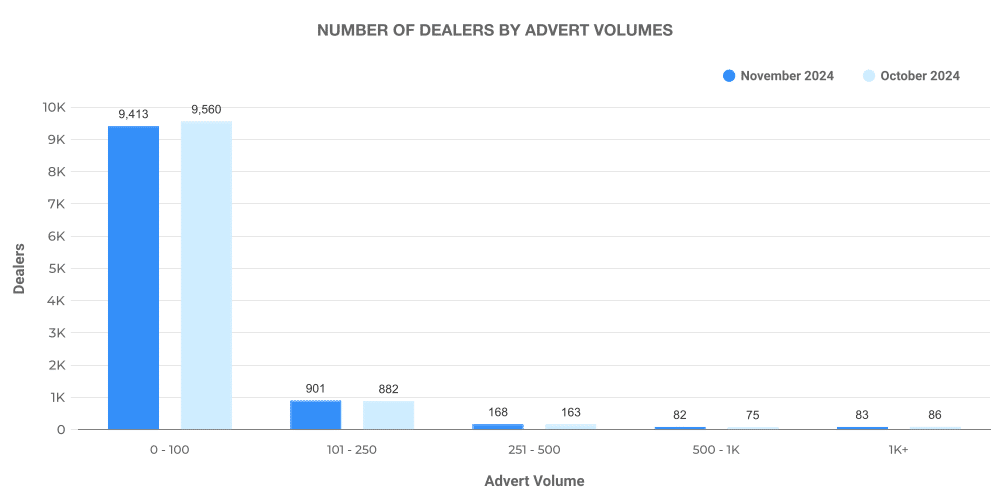
Most dealers list under 100 vehicles, indicating a fragmented market with smaller, independent sellers dominating.
Analysis of Top 100 Dealers by Volume
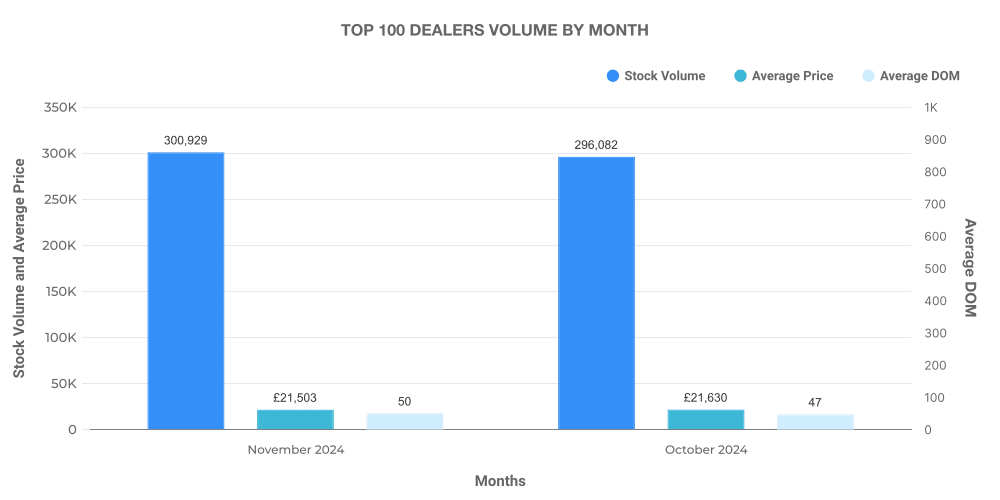
The top 100 dealers held 300,929 ICE listings. Their average DOM was 50 days, notably lower than the market average, with an average price of £21,503. Price increases were recorded in 82,591 cases, while 42,202 listings saw price reductions.
Electric Used Car Market Overview
EV listings continued to grow, with 104,889 vehicles recorded across 4,792 dealers and 8,523 rooftops. The average DOM was 62 days, and the average price was £26,166.
Breakdown of Listings by Price Bands
- £0 – £10,000: 4,164 listings
- £10,000 – £20,000: 37,452 listings
- £20,000 – £30,000: 35,820 listings
- £30,000 – £40,000: 15,012 listings
- £40,000 – £50,000: 5,443 listings
- £50,000+: 5,273 listings
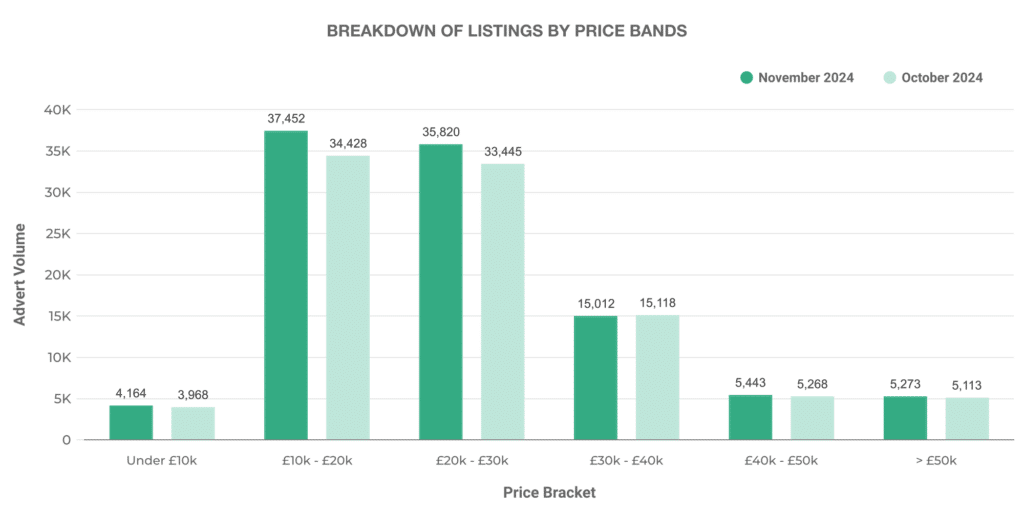
The £10,000 – £20,000 range saw the highest volume, accounting for 35.7% of the market.
Number of Dealers by Advert Volumes
- 0 – 100 vehicles: 4,557 dealers
- 101 – 250 vehicles: 88 dealers
- 251 – 500 vehicles: 29 dealers
- 500 – 1,000 vehicles: 16 dealers
- 1,000+ vehicles: 18 dealers
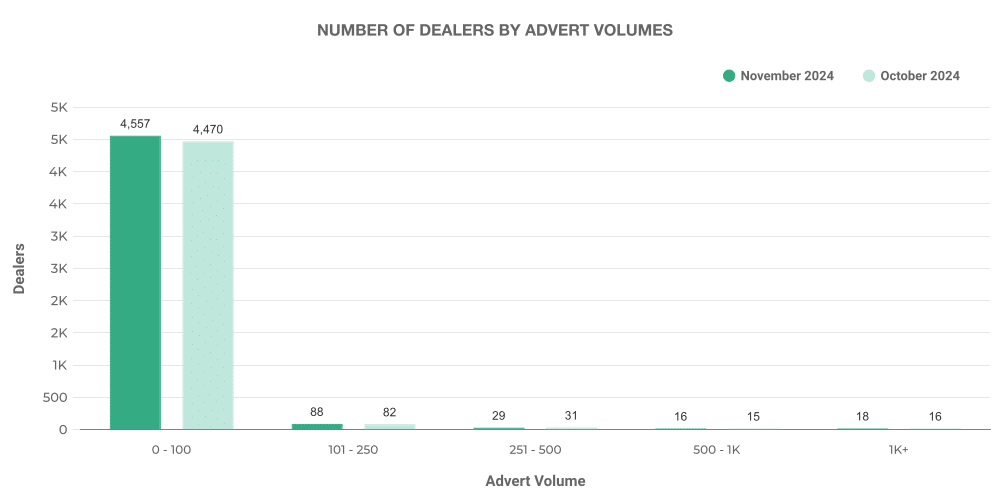
The EV market remains less concentrated than ICE, with most dealers listing fewer than 100 vehicles.
Analysis of Top 100 Dealers by Volume
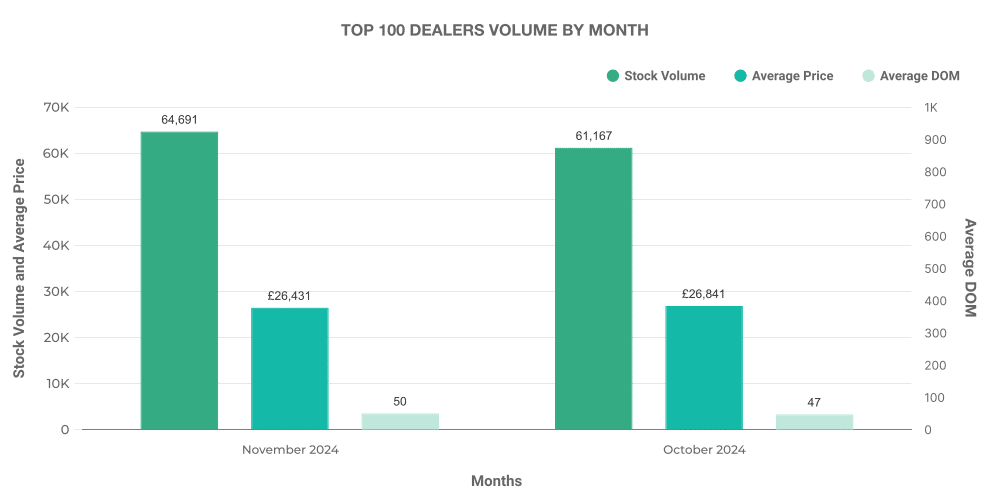
The top 100 EV dealers accounted for 64,691 listings. Their average DOM was 50 days, with an average price of £26,431. Price increases were noted in 18,646 cases, with 92,207 listings seeing price reductions.
EV vs ICE Market Share
EVs represented 12.79% of total used car listings in November, up slightly from 12.30% in October. The average price for EVs was £26,166, compared to £16,737 for ICE vehicles.
Top 10 EV Models by Listings:
- Toyota Yaris – 5,913 listings
- Toyota C-HR – 4,146 listings
- KIA Niro – 3,811 listings
- Toyota Corolla – 3,484 listings
- BMW 3 Series – 2,581 listings
- Tesla Model 3 – 2,436 listings
- Hyundai Kona – 2,380 listings
- Ford Kuga – 2,365 listings
- Toyota RAV4 – 2,332 listings
- Hyundai Tucson – 2,106 listings
The used car market continues to shift, with EVs making incremental gains. Understanding these automotive market insights can help businesses adapt to changing UK car price trends.
Next month: December 2025
