The UK used car market remains a complex and dynamic environment, with both traditional internal combustion engine (ICE) vehicles and the rapidly growing electric vehicle (EV) sector showing distinct patterns. Understanding the pricing trends, dealership volumes, and share of EVs compared to ICE vehicles offers valuable insights into the direction of the market. In this report, we focus on both segments, providing detailed breakdowns of listings, prices, dealer volumes, and key trends from the week of 4th January 2025.
Used Car Market Insights (ICE)
For the week ending 4th January 2025, the UK used car market showed a significant number of ICE vehicles listed, with a total of 599,011 vehicles across 10,480 dealers. The average price of these vehicles stood at £18,601, with a variety of price bands catering to a wide range of budgets.
Price Breakdown of ICE Listings
A notable aspect of the used ICE car market is the price distribution, with the majority of vehicles listed in the £10,000 – £20,000 price band. This price range continues to dominate the market, reflecting consumer demand for mid-range vehicles.
- 0–10K: 175,326 listings
- 10–20K: 230,532 listings
- 20–30K: 109,096 listings
- 30–40K: 37,108 listings
- 40–50K: 13,994 listings
- 50K+: 19,028 listings
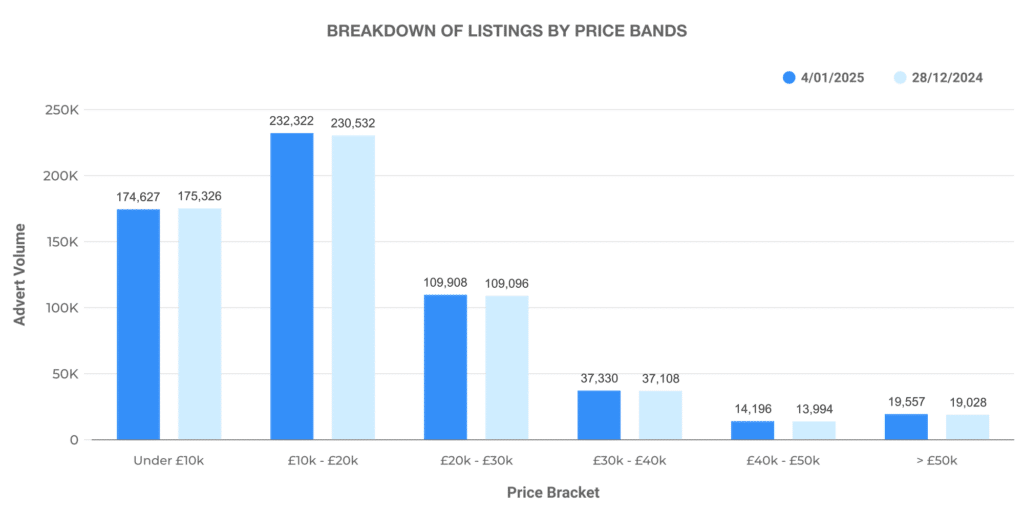
The largest volume of listings can be found in the £10,000 – £20,000 range, accounting for almost 39% of all ICE listings.
Dealer and Inventory Breakdown
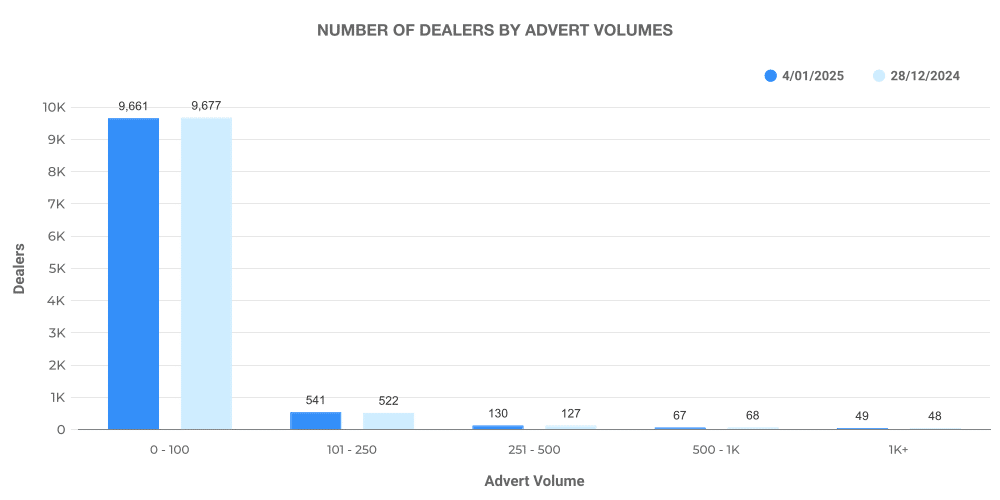
The ICE market is still highly diversified, with a significant portion of dealers listing between 0–100 vehicles. Larger dealers, those listing 500–1,000 vehicles, contribute to the market’s stability and volume.
- 0–100 vehicles: 127 dealers
- 101–250 vehicles: 68 dealers
- 251–500 vehicles: 48 dealers
- 500–1K vehicles: 22 dealers
- 1K+ vehicles: 12 dealers
These figures show the varied dealer landscape in the ICE market, with the top 100 dealers holding a significant share of the stock, contributing 212,583 listings. Their average price point is higher than that of smaller dealers, reflecting a tendency to offer higher-value vehicles.
Price Trends and Market Movements
Looking at the pricing shifts within the top 100 dealers, we see that their average price is above the overall market average, which may indicate a stronger focus on higher-end vehicles. The price increase and decrease figures for these dealers highlight a degree of market adjustment in response to demand and supply factors.
- Top 100 dealers: Average price £22,107
- Outside top 100 dealers: Average price £16,519
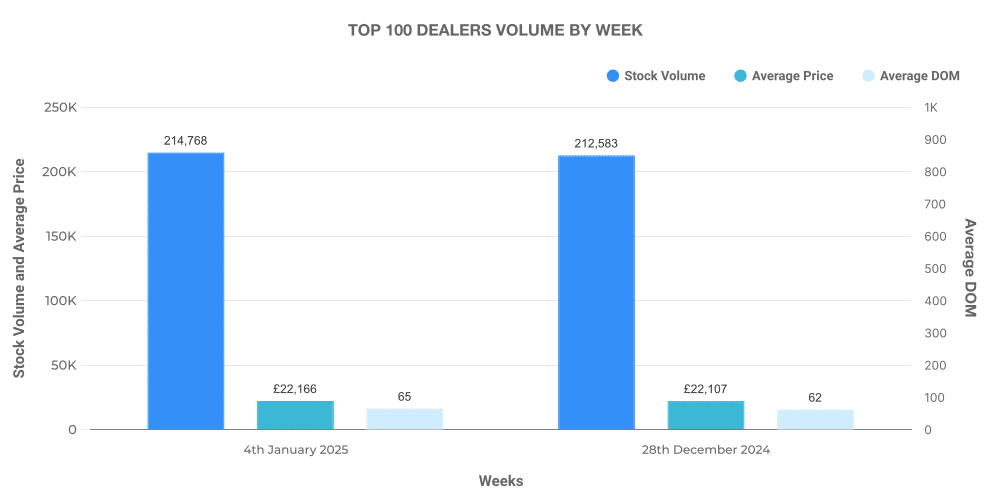
The average days on market (DOM) for these vehicles is also slightly lower for the top 100 dealers, suggesting quicker turnover rates and potentially better stock management.
Electric Used Car Market Insights (EV)
The electric vehicle market, while still smaller in comparison to the ICE market, continues to grow steadily. For the week ending 4th January 2025, a total of 84,272 EVs were listed across 4,412 dealers. The average price for an EV was £26,745, a noticeable premium over the ICE market’s average price of £18,601.
Price Breakdown of EV Listings
The EV market shows a strong presence in the higher price bands, with a considerable number of listings in the £20,000 – £30,000 range.
- 0–10K: 3,056 listings
- 10–20K: 29,326 listings
- 20–30K: 27,972 listings
- 30–40K: 12,114 listings
- 40–50K: 4,469 listings
- 50K+: 4,680 listings
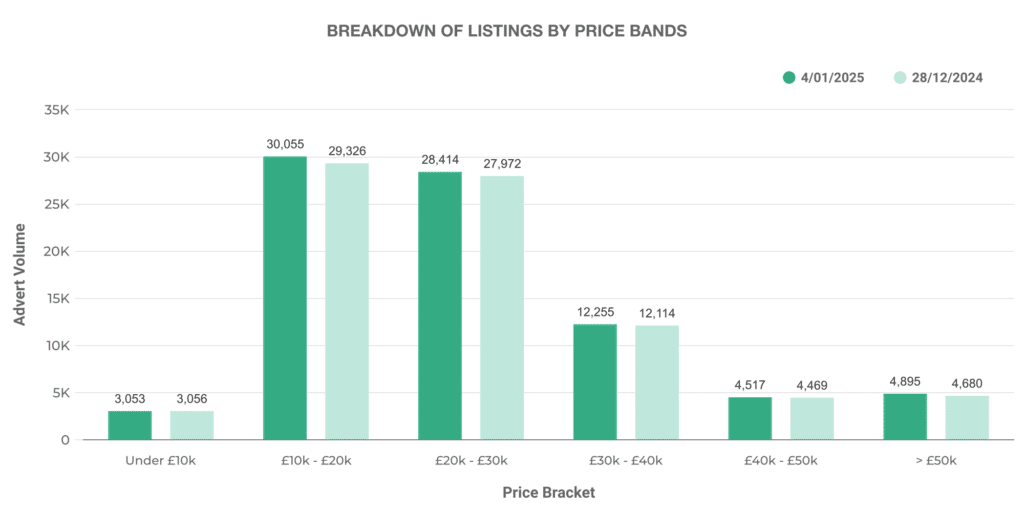
The £10,000 – £20,000 and £20,000 – £30,000 price bands together make up more than half of the total listings, reflecting the increasing demand for affordable electric vehicles that meet the needs of a wide range of consumers.
Dealer and Inventory Breakdown
In contrast to the ICE market, the EV market has fewer dealers with large inventories, indicating that EVs are still relatively new to many dealerships. The breakdown of listings by dealer volume reveals the early stages of growth for electric vehicles in the used car sector.
- 0–100 vehicles: 24 dealers
- 101–250 vehicles: 12 dealers
- 251–500 vehicles: 13 dealers
- 500–1K vehicles: 7 dealers
- 1K+ vehicles: 13 dealers
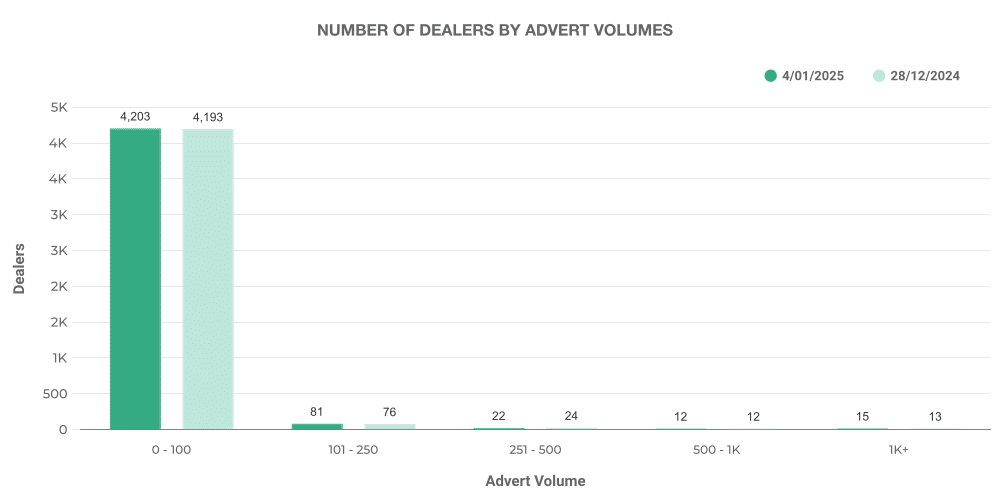
This highlights that the EV market is still evolving, and larger dealerships are beginning to dedicate more space to electric vehicles.
Price Trends and Market Movements
Similar to the ICE market, the top 100 EV dealers have a higher average price point compared to smaller dealers. This reflects a trend towards selling more expensive models, likely due to the increasing popularity of premium electric cars.
- Top 100 EV dealers: Average price £26,758
- Outside top 100 EV dealers: Average price £26,724
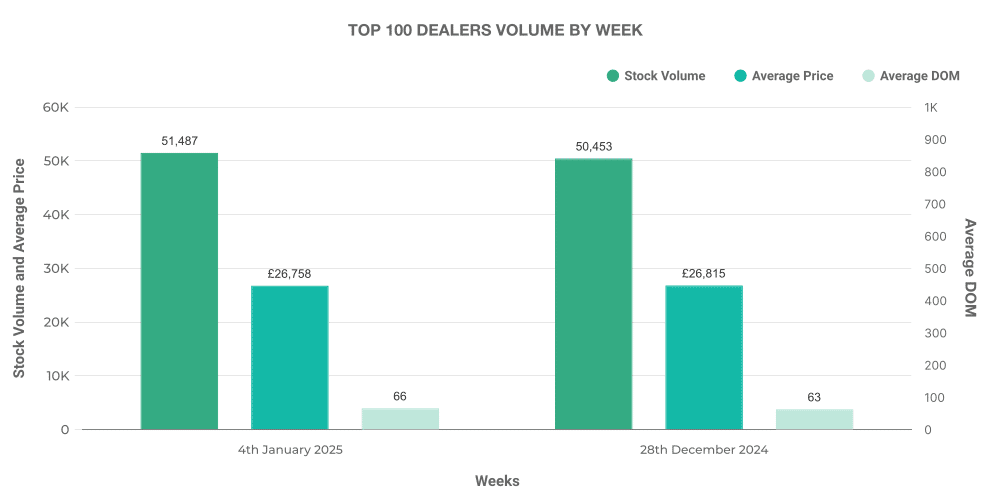
The average days on market for EVs is also slightly higher for the top 100 dealers, which may indicate longer selling cycles as the market for used electric vehicles matures.
EV Market Share Compared to ICE Market
The percentage share of EVs compared to ICE vehicles remains a significant point of analysis. As of the week ending 4th January 2025, EVs accounted for 14.07% of all used car listings, with ICE vehicles comprising the remaining 85.93%.
- Percentage of EV listings: 14.07%
- Percentage of ICE listings: 85.93%
This figure demonstrates the growing presence of electric vehicles in the market, albeit still far behind ICE vehicles in terms of overall volume. However, the increasing variety of electric models and a gradual shift in consumer preferences signal a promising future for EVs in the used car sector.
Next week: 11th January | Previous month: December 2024
