UK Weekly Used Car Market Data – January 2025
Keeping a tab on the sands of the used car market – both for combustion engine vehicles (ICE) and electric vehicles (EV) – is essential for businesses involved in the automotive sector. As a trusted data partner providing comprehensive and up-to-date automotive inventory data, Marketcheck presents an analysis of key trends shaping the UK used car market.
ICE Cars in the Spotlight
The week ending 25th January 2025 saw as many as 10,489 dealers listing a total of 592,307 used ICE cars. The average price of the ICE cars listed for this week was markedly lower at £18,731 compared to EVs.
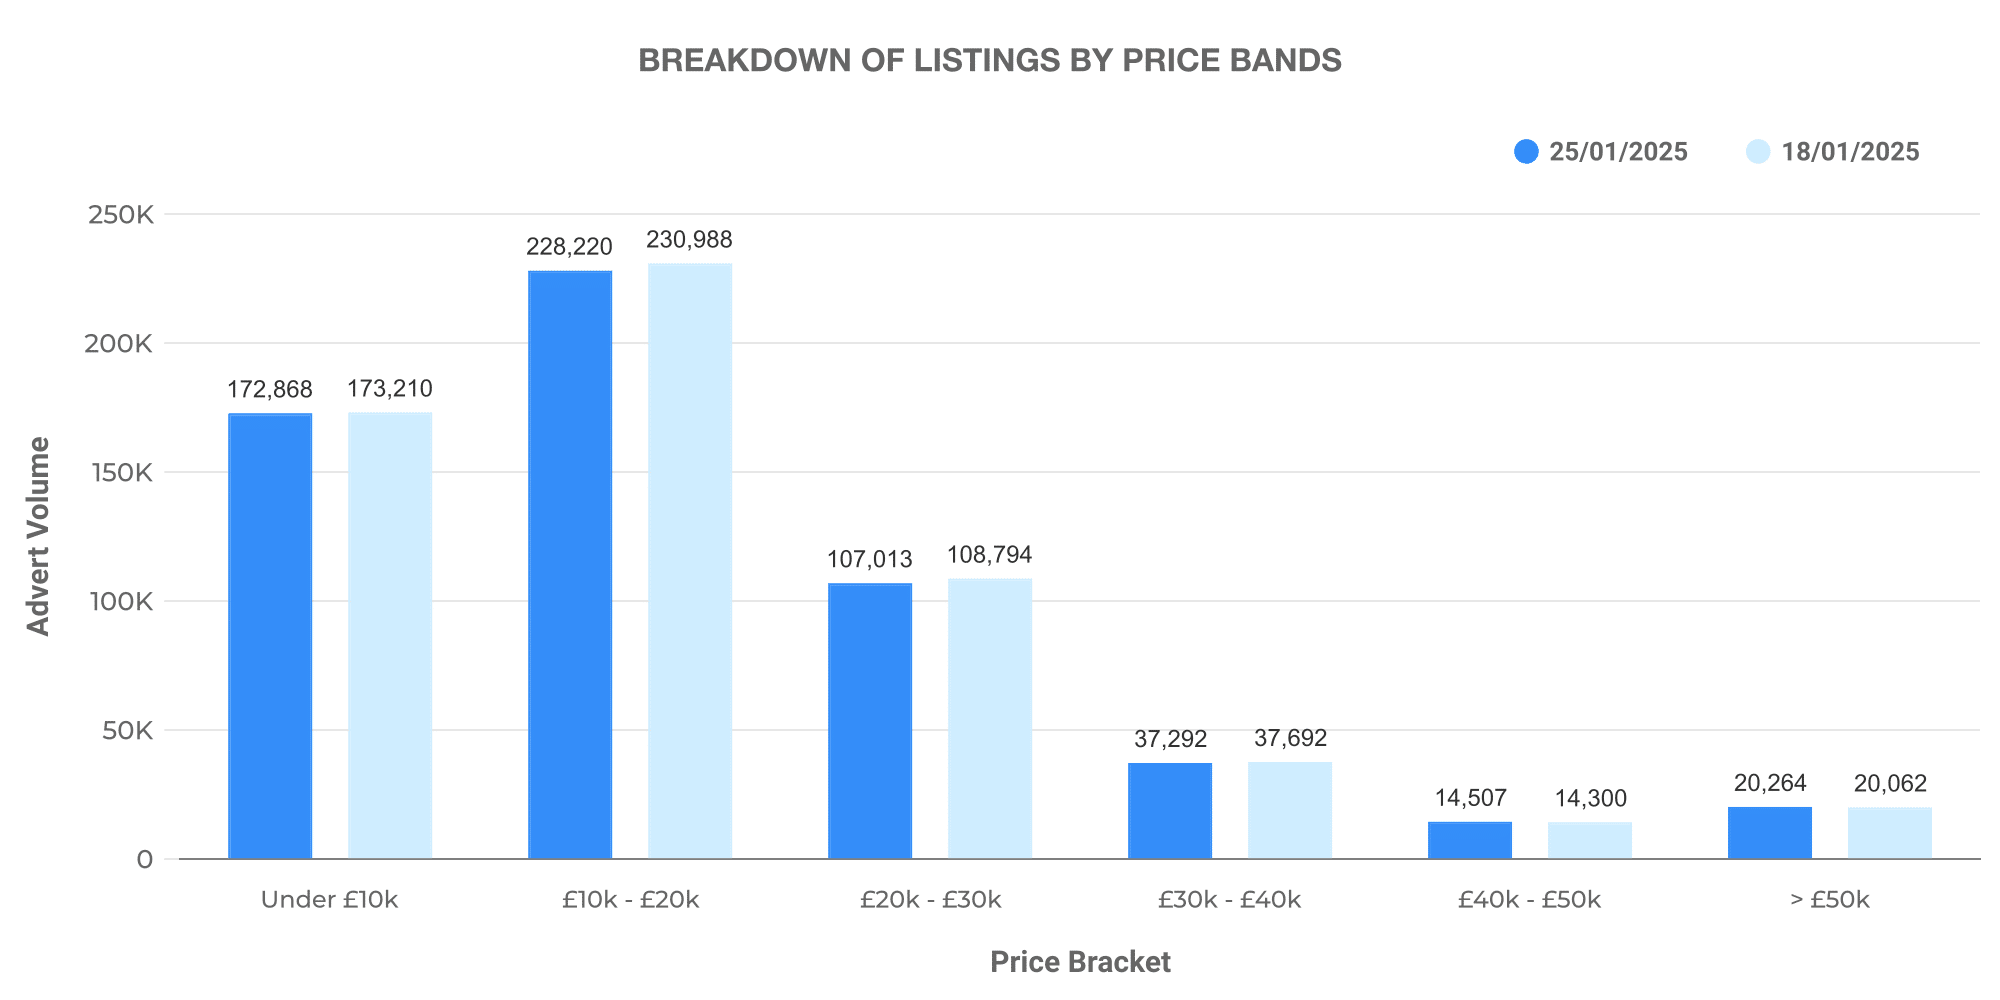
The price band distribution chart attests that a significant proportion of the listed ICE cars fell within the £10,000 – £20,000 range. A noticeable number of luxury models priced over £50,000 also contributed to the market.
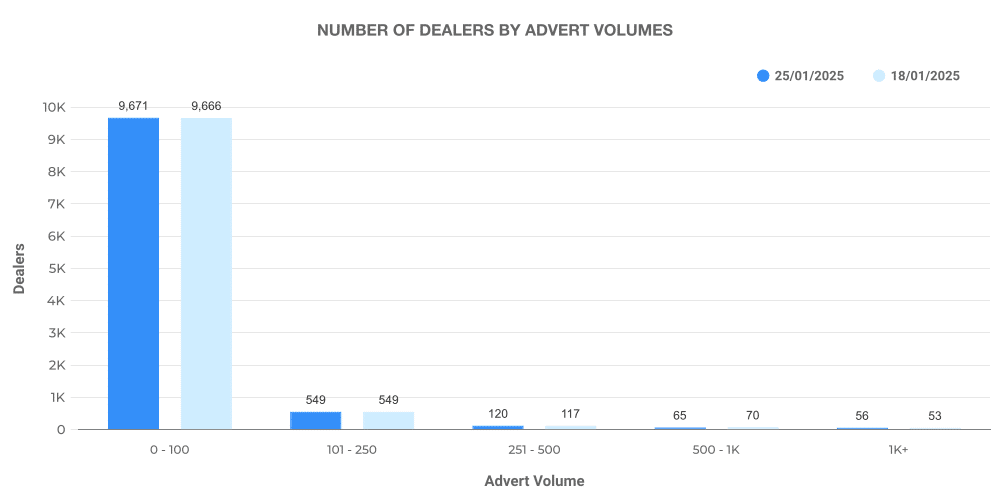
Turning to the number of ICE cars advertised by dealers, we find a steady trend with the majority of dealers listing between 0-100 vehicles.
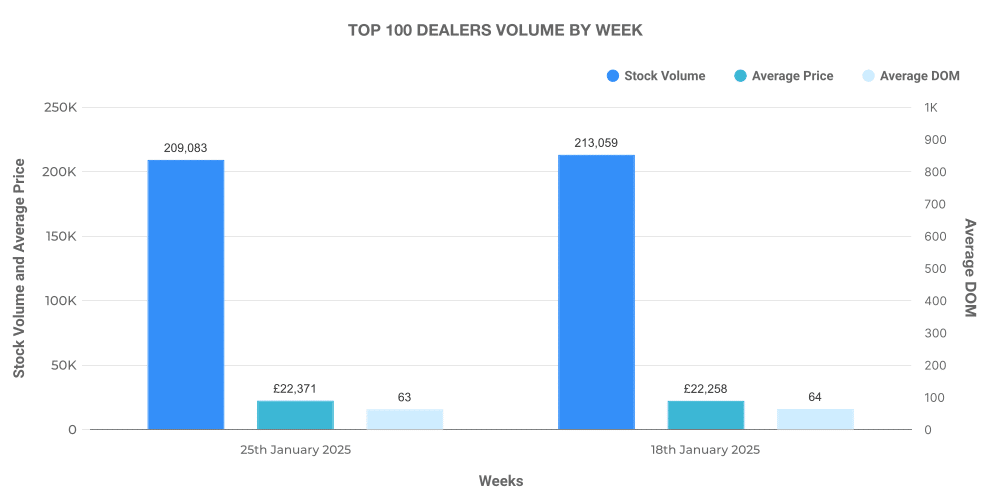
Taking a closer look at the top 100 ICE car dealers shows they accounted for just over 15% of total listings, with their average car price edging slightly above the market average.
Electric Car Market Progress
Shifting gears to the electric used car market, the data shows us a vibrant industry on a growth path. For the same week, 4466 dealers listed a total of 87,739 used EVs with an average price of £26,742.
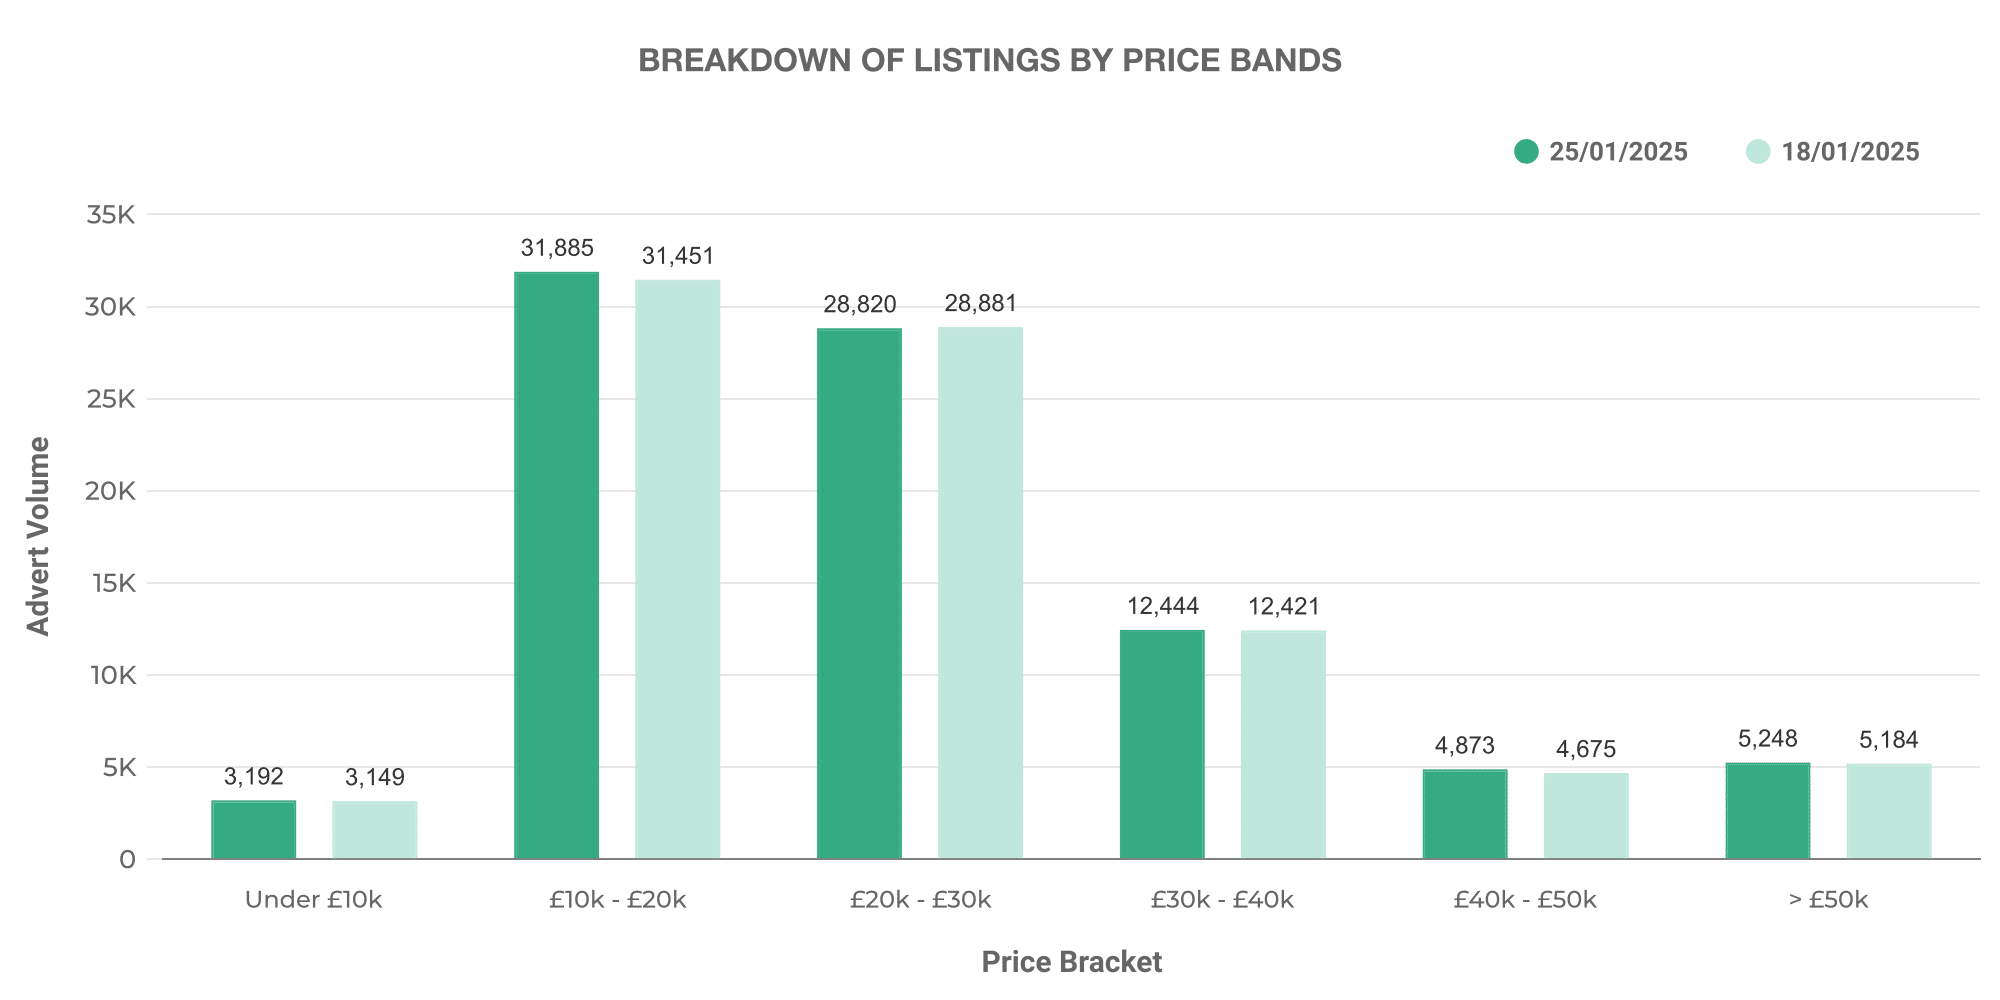
The majority of used EVs were priced within the £10,000 – £20,000 bracket, mirroring a trend in the ICE market. However, the existence of a considerable number of EVs in the £30,000 – £40,000 and above £50,000 price brackets signifies the market’s adaptation to varied customer requirements and budgets.
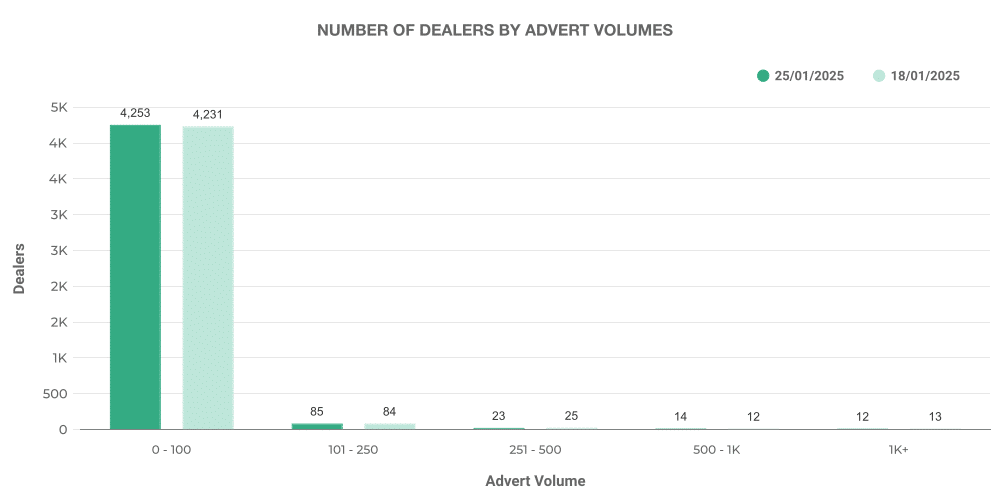
Looking at dealer volumes for EVs, most dealers listed between 0-100 vehicles – a clear mark of the transition phase this sector is experiencing.
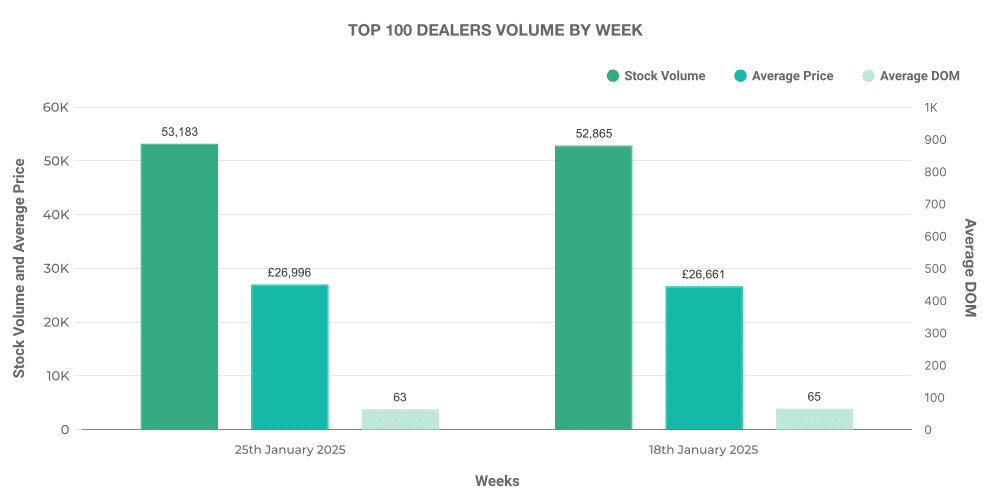
The top 100 dealers in the used EV market accounted for almost 16.5% of total listings. Interestingly, these dealers also commanded a slightly higher average price than that of the overall used EV market average.
Comparison: ICE vs EV
The week revealed a rise in the percentage share of used EVs up for sale, with a recorded 14.81% from last week’s 14.57%. Despite this, ICE vehicles continue to dominate the market with a robust 85.19% share.
Looking at average prices, used EVs tracked at £26,742, higher than the ICE cars at £17,327 on average. This suggests EVs are proving to be a lucrative section of the used car market in the UK.
The leading used EV models listed during the week included the ‘Toyota Yaris’, ‘KIA Niro’, ‘Toyota C-HR’, ‘Toyota Corolla’, and the ‘Tesla Model 3’, among others.
These insights provide us with a snapshot of the current UK used car market – highlighting significant trends and key data points. For businesses looking to boost their automotive strategies, such insights into current and historical used car listings can be invaluable. For more information or to access our extensive automotive inventory data, get in touch with Marketcheck today.
Next week: 1st February | Previous week: 18th January
