
UK Weekly Used Car Market Data – February 2025
Delving into the complex patterns of the UK automotive sector with its constantly evolving dynamics is essential for businesses engaged in the used car market. This analysis breaks down the UK used car market data for the week starting 25th January through 1st February 2025 and offers insights into electric used car market trends and UK car price trends.
Used Car Market (ICE)
There were a total of 586,053 ICE (Internal Combustion Engine) used car listings, posted by 10,455 dealers for the week ending 1st February 2025.
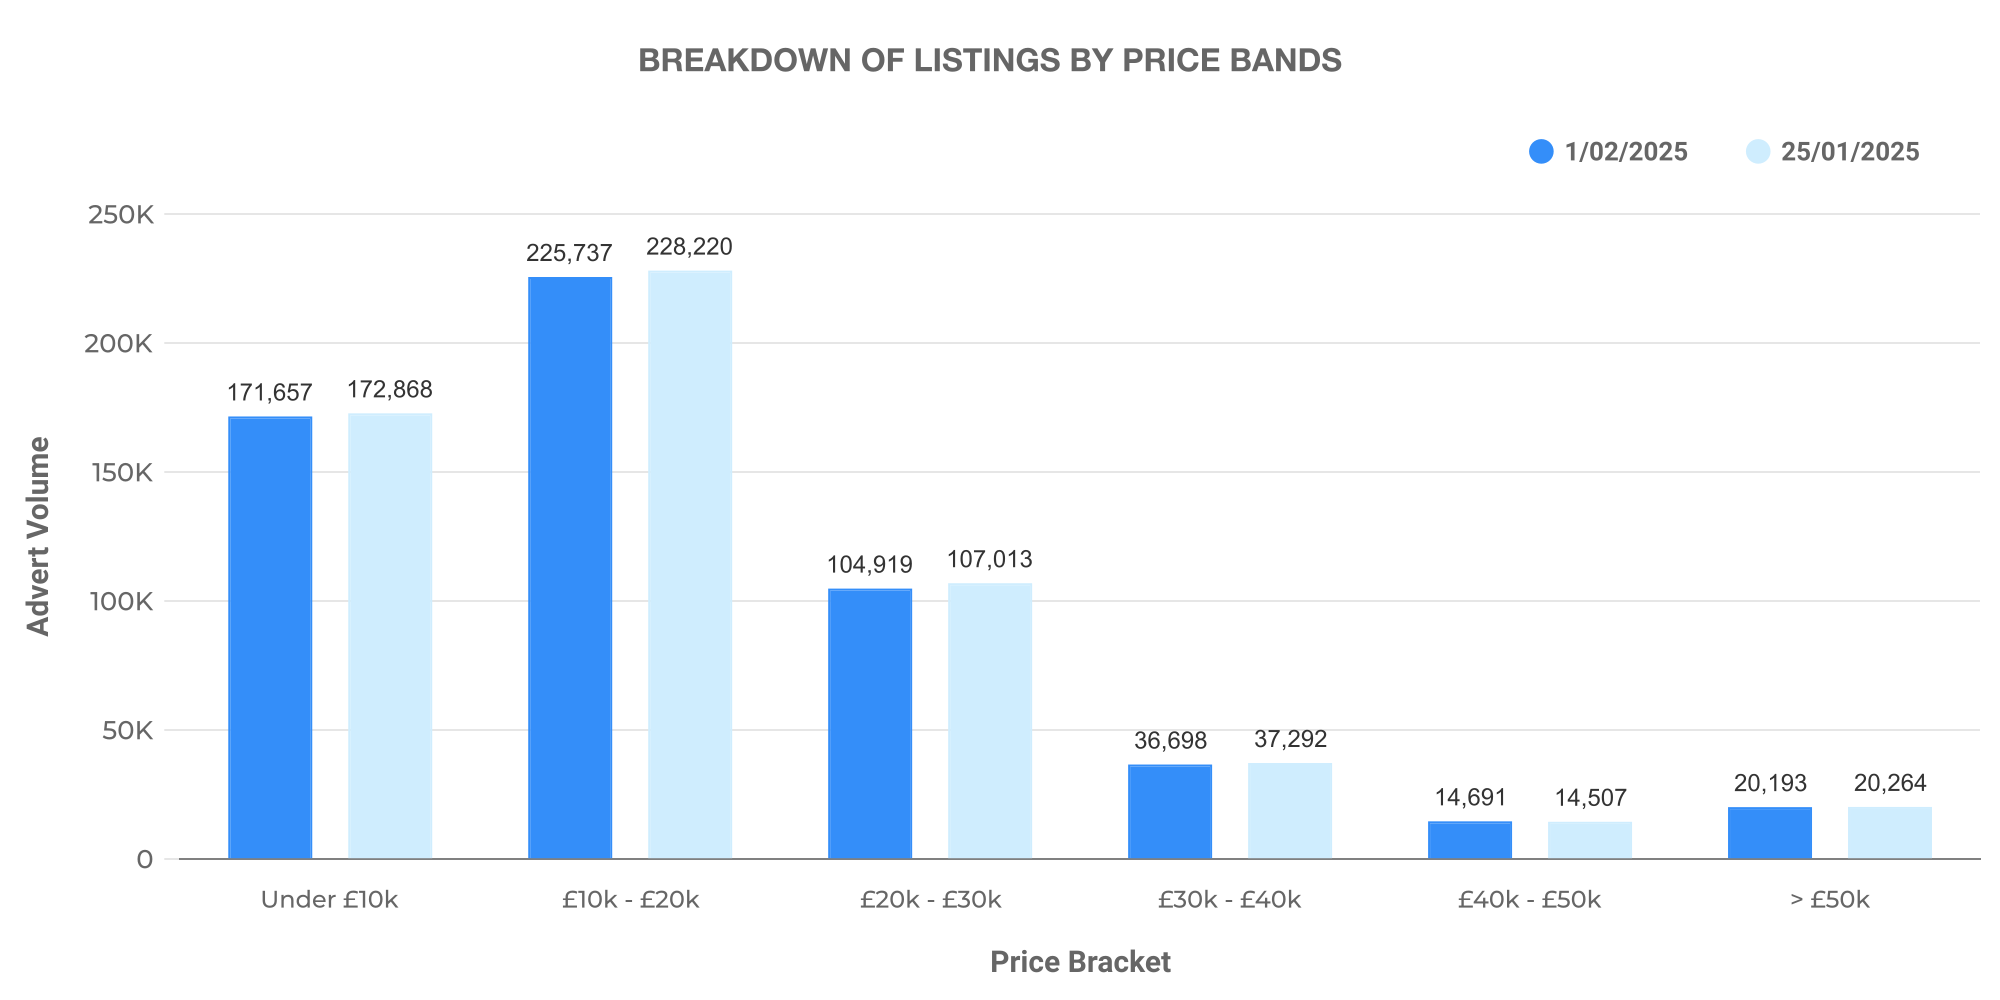
This graph represents these listings by price bands for the week. The highest number of listed ICE vehicles fell within the £10,000 – £20,000 range followed by fewer vehicles in the £20,000 – £30,000 range. The average price of listed ICE cars is £18,736.
Next, we will take a look at the distribution of dealer volume across the market.

This graph illustrates the distribution of dealer volumes for ICE vehicle listings. Most dealers listed between 0 – 100 vehicles.
Top 100 ICE Vehicle Dealers:

The top 100 ICE vehicle dealers accounted for 35.2% of the total advertisements with an average listing price slightly higher than the market average at £22,446. They experienced a slight increase in advertised prices by 1,754 compared to the previous week.
Electric Used Car Market (EV)
For the same week, the electric used car market saw a total of 88,052 EV (Electric Vehicles) listings posted by 4,464 dealers.

As per the graph, most listed EVs fell in the £10,000 – £20,000 category, with fewer in the £20,000 – £30,000 category. However, EVs tend to have a higher average listing price than ICE vehicles, coming in at £26,740.
Going further, examining the EV dealership volume gives a more clear understanding of the UK EV used car market.

Similar to ICE vehicle listings, most EV dealers posted between 0 -100 vehicles, indicating the relative novelty of this market compared to ICE vehicles.
Top 100 EV Dealers:

The top 100 EV dealers accounted for 60.7% of total listings, with a price increase of 1,471 compared to the previous week’s trend.
Comparison: ICE vs EV
Comparing the respective markets for ICE vehicles and EVs reveals that the volume of listed EVs has reached a high of 15.02%, reflecting ongoing shifts in buyer preference in line with sustainability trends.
On the other hand, the average listing price is significantly higher for EVs (£26,740) than for ICE vehicles (£18,736), suggesting that the EV market retains higher value propositions.
Stay tuned to Marketcheck UK for ongoing automotive market insights and trends analysis to inform your business strategies.
Next week: 8th February | Previous week: 25th January