Understanding movements in the used car market helps those in the UK automotive sector refine their stock strategies and stay ahead. From retail dealers and insurers to auction houses and lenders, the data from January 2025 provides a timely update on pricing, listing volumes, and the ongoing shift towards electric vehicles. This month’s report compares the latest market data with December 2024 to provide a clear picture of how the new year has started.
Used car market (ICE): Headline numbers
The petrol and diesel car market remained strong in January 2025, with 773,858 listings posted by 10,624 dealers across 15,239 rooftops. This marks a slight rise in listings compared to December, with a minor increase in average days on market (from 86 to 88). Average prices remained stable at £18,320.
Price band analysis:
- £0–£10K: 228,263 listings
- £10K–£20K: 301,913 listings
- £20K–£30K: 138,389 listings
- £30K–£40K: 46,586 listings
- £40K–£50K: 17,682 listings
- £50K+: 24,280 listings
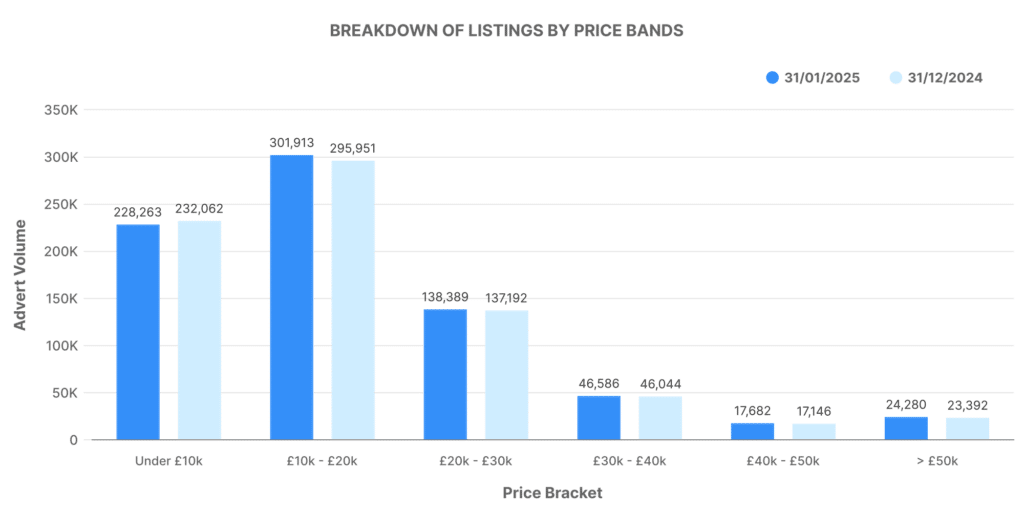
The majority of stock remained concentrated in the £10,000–£20,000 band, consistent with previous months. There was also a slight increase in high-value vehicles (£50K+), showing stable demand at the premium end of the used car market.
Graph Analysis: Breakdown of Listings by Price Bands (ICE)
The price distribution continues to show a skew towards lower- and mid-range vehicles. Over 68% of listings fell within the £0–£20K bracket, which remains the core of UK retail activity. Listings priced between £20K–£30K formed a secondary band of focus, while listings above £40K represent only a small slice of the market.
Number of dealers by advert volumes (ICE)
Looking at dealer inventory volumes:
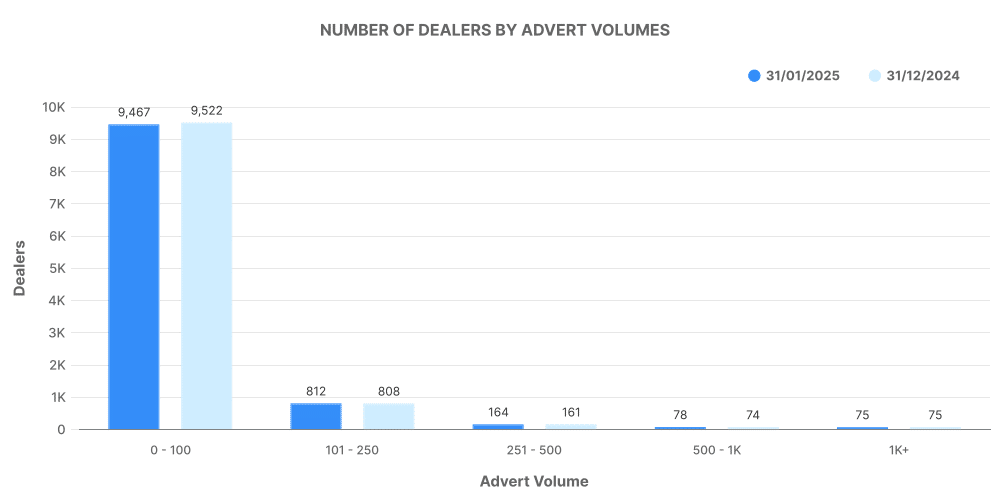
- 0–100 vehicles: 9,467 dealers
- 101–250 vehicles: 812 dealers
- 251–500 vehicles: 164 dealers
- 500–1,000 vehicles: 78 dealers
- 1,000+ vehicles: 75 dealers
Graph Analysis: Number of Dealers by Advert Volumes (ICE)
The data shows most used car dealers operate at a relatively low scale, with over 89% listing fewer than 100 cars. Only 0.7% of dealers manage inventories above 1,000 vehicles, typically larger dealer groups or marketplaces. This consistency confirms the fragmented nature of the UK used car retail space.
Top 100 ICE dealers: Stock and pricing
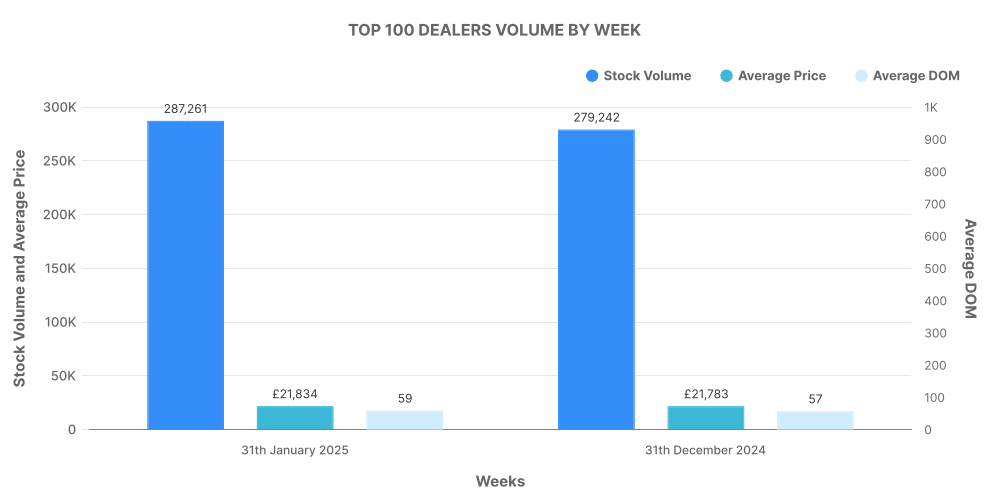
In January, the top 100 ICE dealers accounted for 287,261 listings — roughly 37% of the market. Their average price was £21,834, notably above the market average of £18,320. Their average DOM was 59 days, compared to the overall market’s 88 days, indicating faster stock movement among higher-volume retailers.
- Price increases: 62,567
- Price decreases: 302,553
Graph Analysis: Top 100 Dealers by Volume (ICE)
These dealers tend to operate in higher-value brackets and refresh pricing more actively. While 21% of listings had price increases, nearly 40% were marked down, suggesting continued price corrections as buyers remain value-conscious.
Electric used car market: A steady climb
EV listings continued their upward trend, reaching 111,484 in January 2025 — an increase from December’s 103,920. There were 4,807 EV dealers across 8,567 rooftops, both slightly up from the previous month. The average EV listing sat at £26,241 with an average DOM of 70 days.
Price band analysis (EV):
- £0–£10K: 4,079 listings
- £10K–£20K: 41,475 listings
- £20K–£30K: 36,952 listings
- £30K–£40K: 15,354 listings
- £40K–£50K: 5,736 listings
- £50K+: 6,118 listings
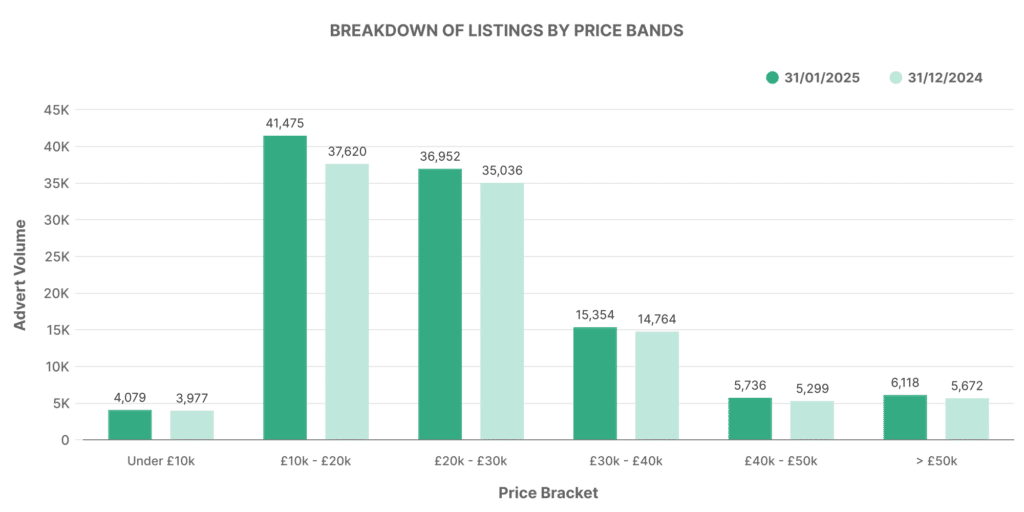
The £10K–£30K bracket dominates the electric used car market, reflecting broader adoption as ex-fleet and lease EVs become more accessible.
Graph Analysis: Breakdown of Listings by Price Bands (EV)
More than 70% of electric listings fall within the £10K–£30K range, showing how used EVs are now priced closer to traditional combustion vehicles. There’s also growing volume in the £30K+ bands, with more Tesla, BMW, and premium models entering the second-hand market.
Number of EV dealers by advert volumes
- 0–100 vehicles: 6,118 dealers
- 101–250 vehicles: 4,556 dealers
- 251–500 vehicles: 85 dealers
- 500–1,000 vehicles: 37 dealers
- 1,000+ vehicles: 17 dealers
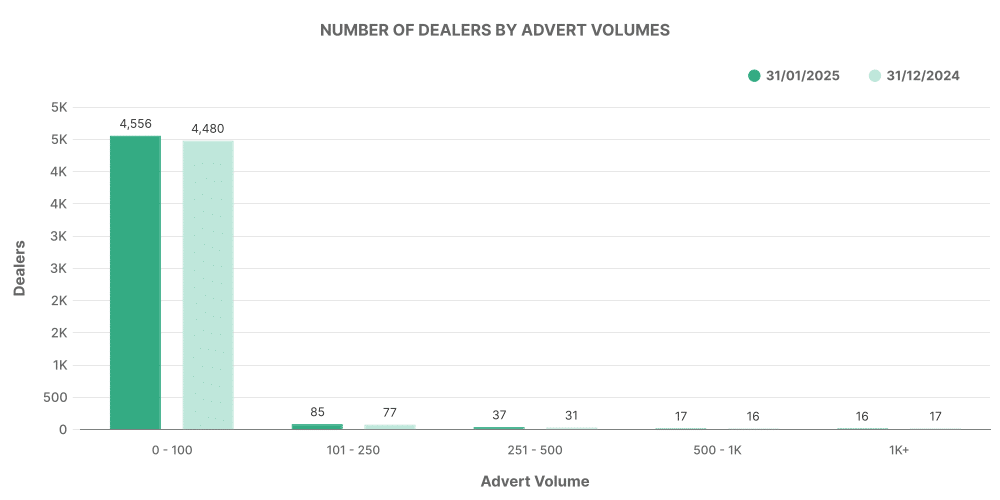
Graph Analysis: Number of Dealers by Advert Volumes (EV)
EV inventory is still heavily concentrated among smaller-scale dealers, though a growing number are scaling up. Only 1.7% of dealers listed more than 250 EVs, highlighting the continued opportunity for retail businesses to scale their electric stock.
Top 100 EV dealers: Stock and pricing
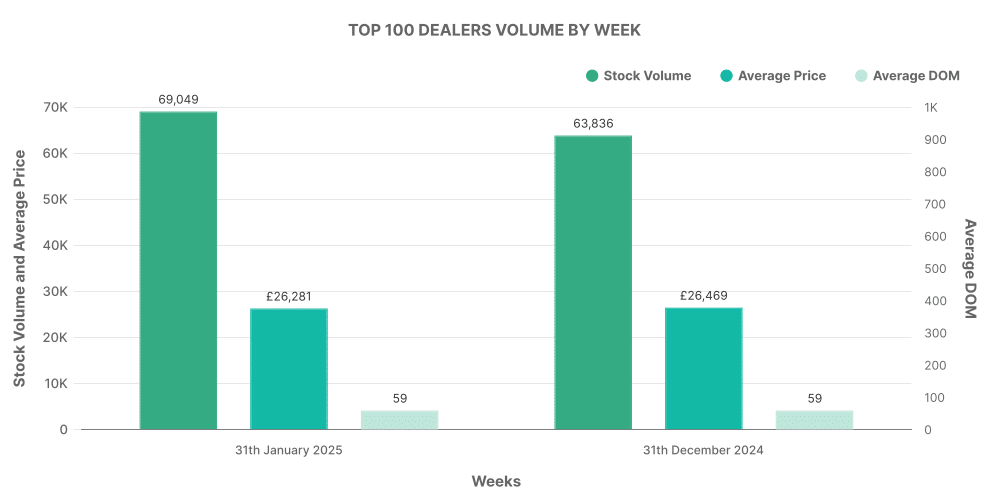
The top 100 EV dealers listed 69,049 vehicles, about 62% of the entire EV market. Their average DOM was 59 days — equal to ICE top dealers — with average pricing sitting at £26,281.
- Price increases: 14,850
- Price decreases: 83,035
Graph Analysis: Top 100 Dealers by Volume (EV)
Top EV dealers handle significantly more stock and show a heavy tilt towards price decreases — over 74% of listings had a price drop in January. This suggests a more aggressive pricing approach to maintain turnover as used EV volumes increase.
Leading makes and models (EV)
The most listed EVs for January were:
- Toyota Yaris – 5,165
- KIA Niro – 3,833
- Toyota C-HR – 3,724
- Toyota Corolla – 3,357
- Tesla Model 3 – 3,011
- BMW 3 Series – 2,647
- Ford Kuga – 2,549
- Hyundai Kona – 2,344
- Hyundai Tucson – 2,026
- Toyota RAV4 – 2,000
The Toyota brand dominates EV listings, with four models in the top ten. Tesla continues to lead the premium space, while the KIA Niro and Hyundai models offer value-focused alternatives.
EV share vs ICE in the used car market
EV listings made up 14.41% of the overall used car market in January 2025 — a modest increase from 13.55% in December. This marks the fifth consecutive month of growth in EV share.
Breakdown:
- EV: 14.41% (111,484 listings)
- ICE: 85.59% (773,858 listings)
Average EV price: £26,240
Average ICE price: £16,978
Electric vehicles still command a higher average asking price, though the gap has narrowed slightly since last month. This could reflect growing volumes in lower price bands and increased pricing sensitivity among EV buyers.
Key takeaways for the automotive sector
- Listings of both ICE and EV vehicles increased in January, with dealer numbers holding steady.
- Stock remains focused in the £10K–£20K price band for ICE and £10K–£30K for EVs.
- The top 100 dealers — both ICE and EV — continue to outperform the rest of the market in terms of stock volume and speed to sale.
- EV listings are rising steadily, now accounting for over 14% of all used car adverts.
- Toyota continues to dominate the EV listing volumes, followed by KIA and Tesla.
For those involved in automotive retail, auctions, or finance, tracking shifts in price bands, average pricing, and listing volumes can highlight buying opportunities and inform risk decisions. The electric used car market is growing and becoming more varied — an indicator that EV adoption is no longer a fringe consideration, but a core part of inventory planning.
To access granular data down to individual listings, make and model breakdowns, and dealership performance, speak to Marketcheck UK. We provide real-time and historical datasets tailored to the UK automotive sector, whether via APIs, spreadsheets, or custom tools.
Next month: February 2025 | Previous month: December 2024
