Delves into the UK used car market, this analysis focuses on both combustion engine vehicles (ICE) and the growing prominence of the electric used car market (EV). Offering insights that stretch beyond the traditional, this report reveals automotive market insights and provides a comprehensive understanding of UK car price trends.
Understanding Combustion Engine Vehicles
For the week ending on the 28th of June 2025, the ICE market saw a total of 607,170 used cars listed by 10,699 dealers.
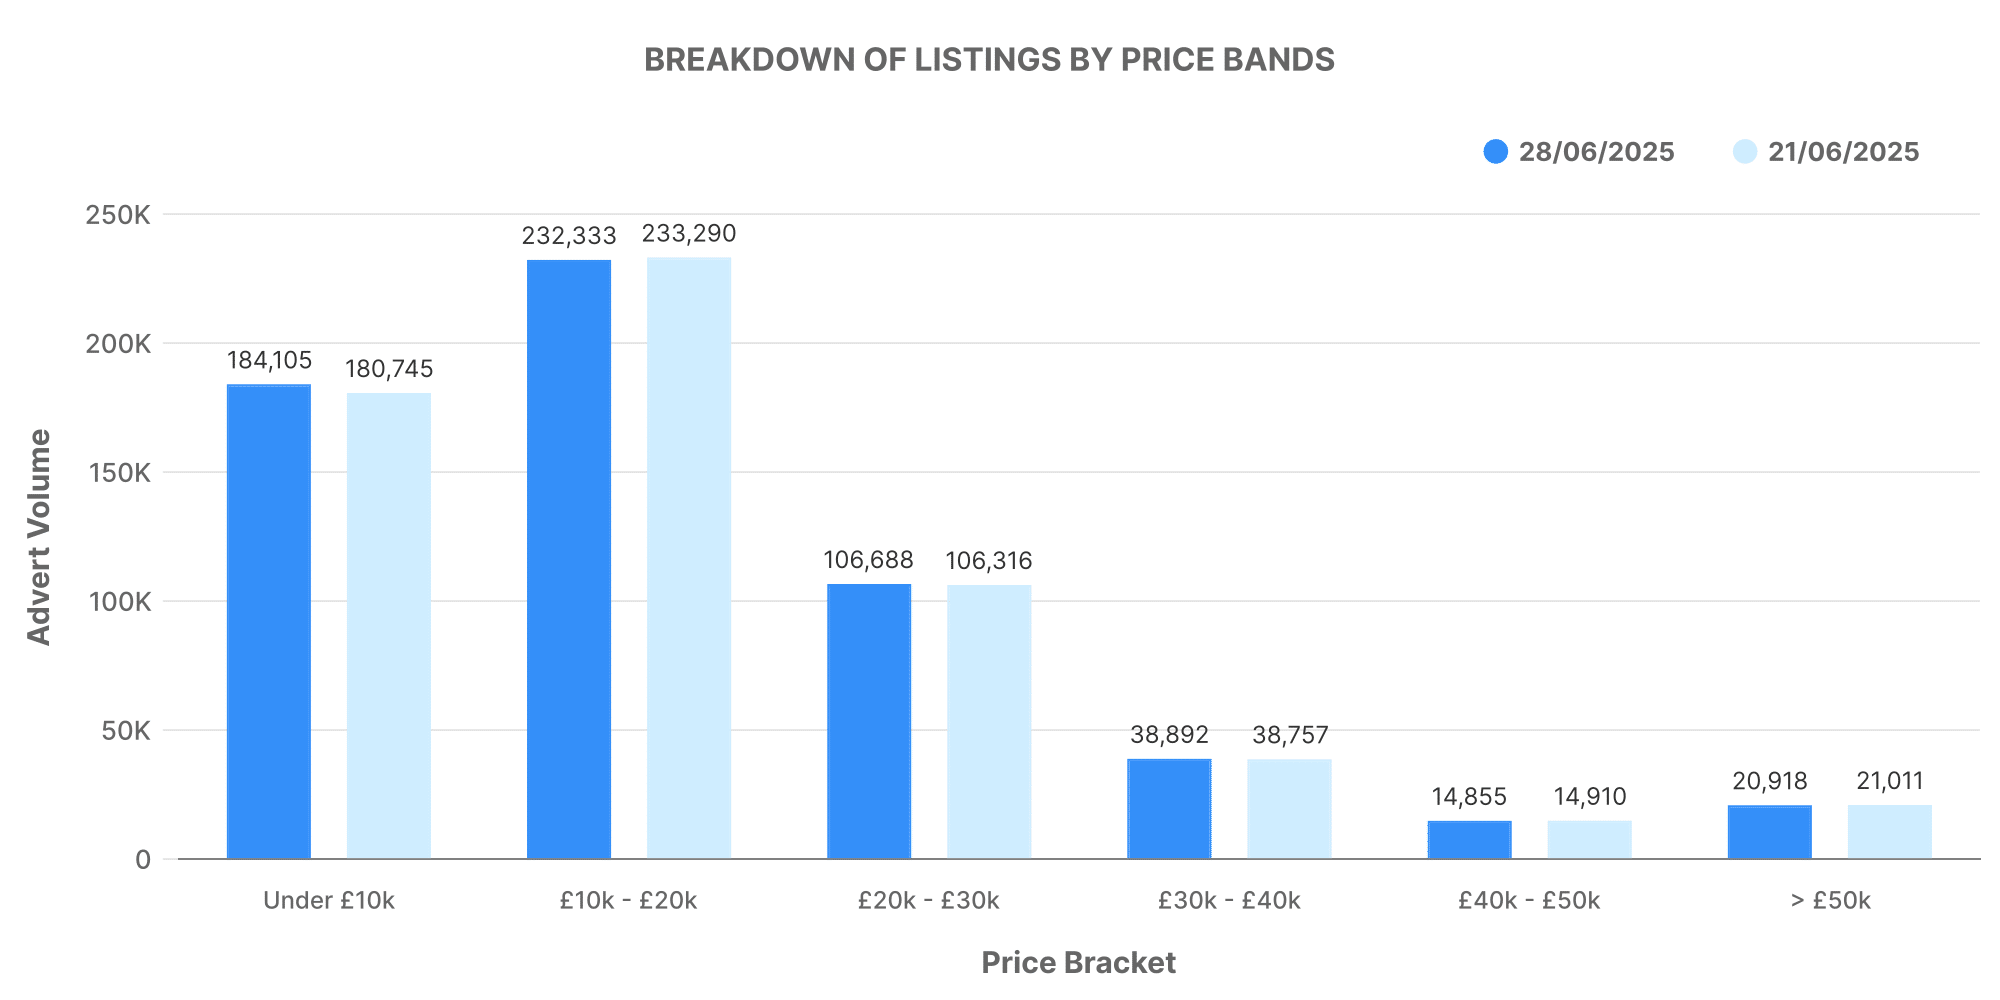
Diving into the image above, the majority of ICE cars listed fell between the £10,000 – £20,000 range, with a significant number within the £20,000 – £30,000 bracket, and an average price of around £18,620.
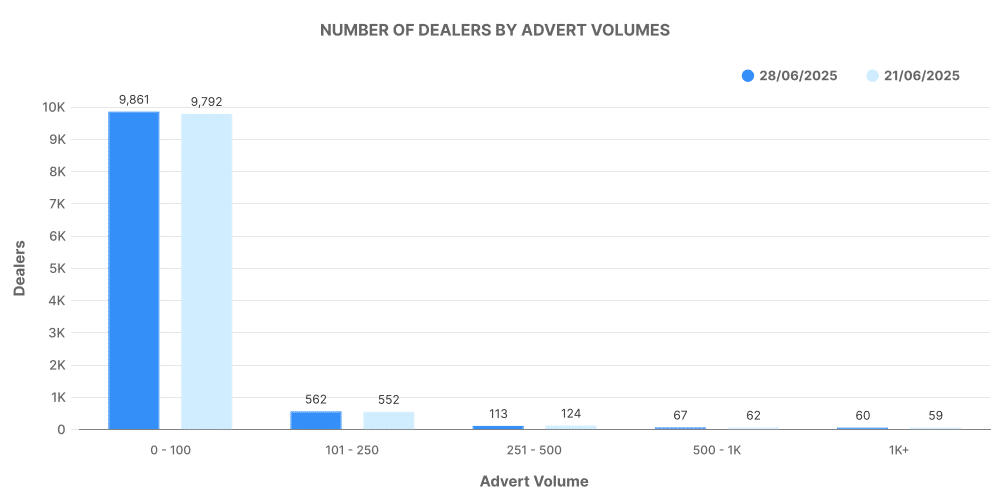
When breaking down dealership volume, the image above showcases that most ICE car volumes are proportionally balanced among dealers, which indicates the diversity and expansive nature of this market.
Top 100 Dealers for ICE Cars
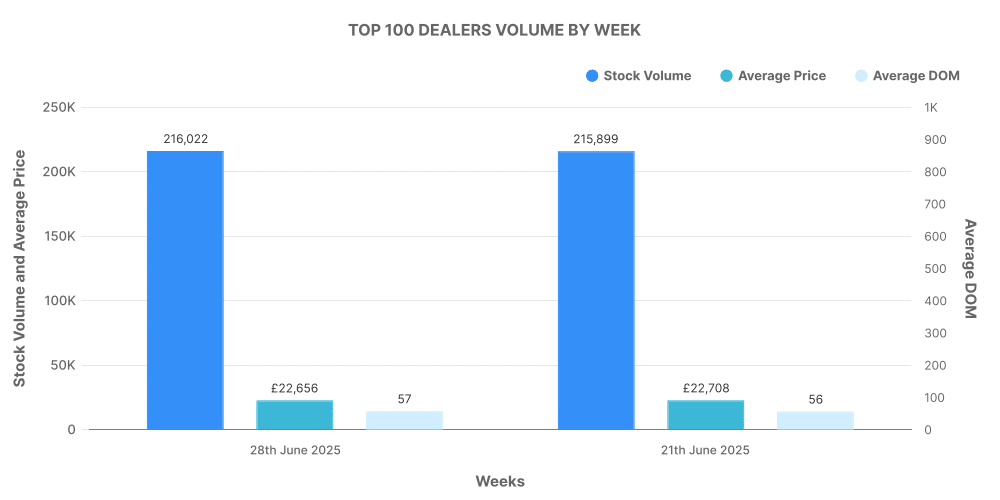
The top 100 ICE car dealers accounted for 15.5% of the total listing volume, based on the image above. Intriguingly, these dealers also sell cars with prices above the market average.
Exploring Electric Used Car Market
Turning our attention to the EV market, for the same week, 94,932 used EVs were listed by 4,784 dealers.
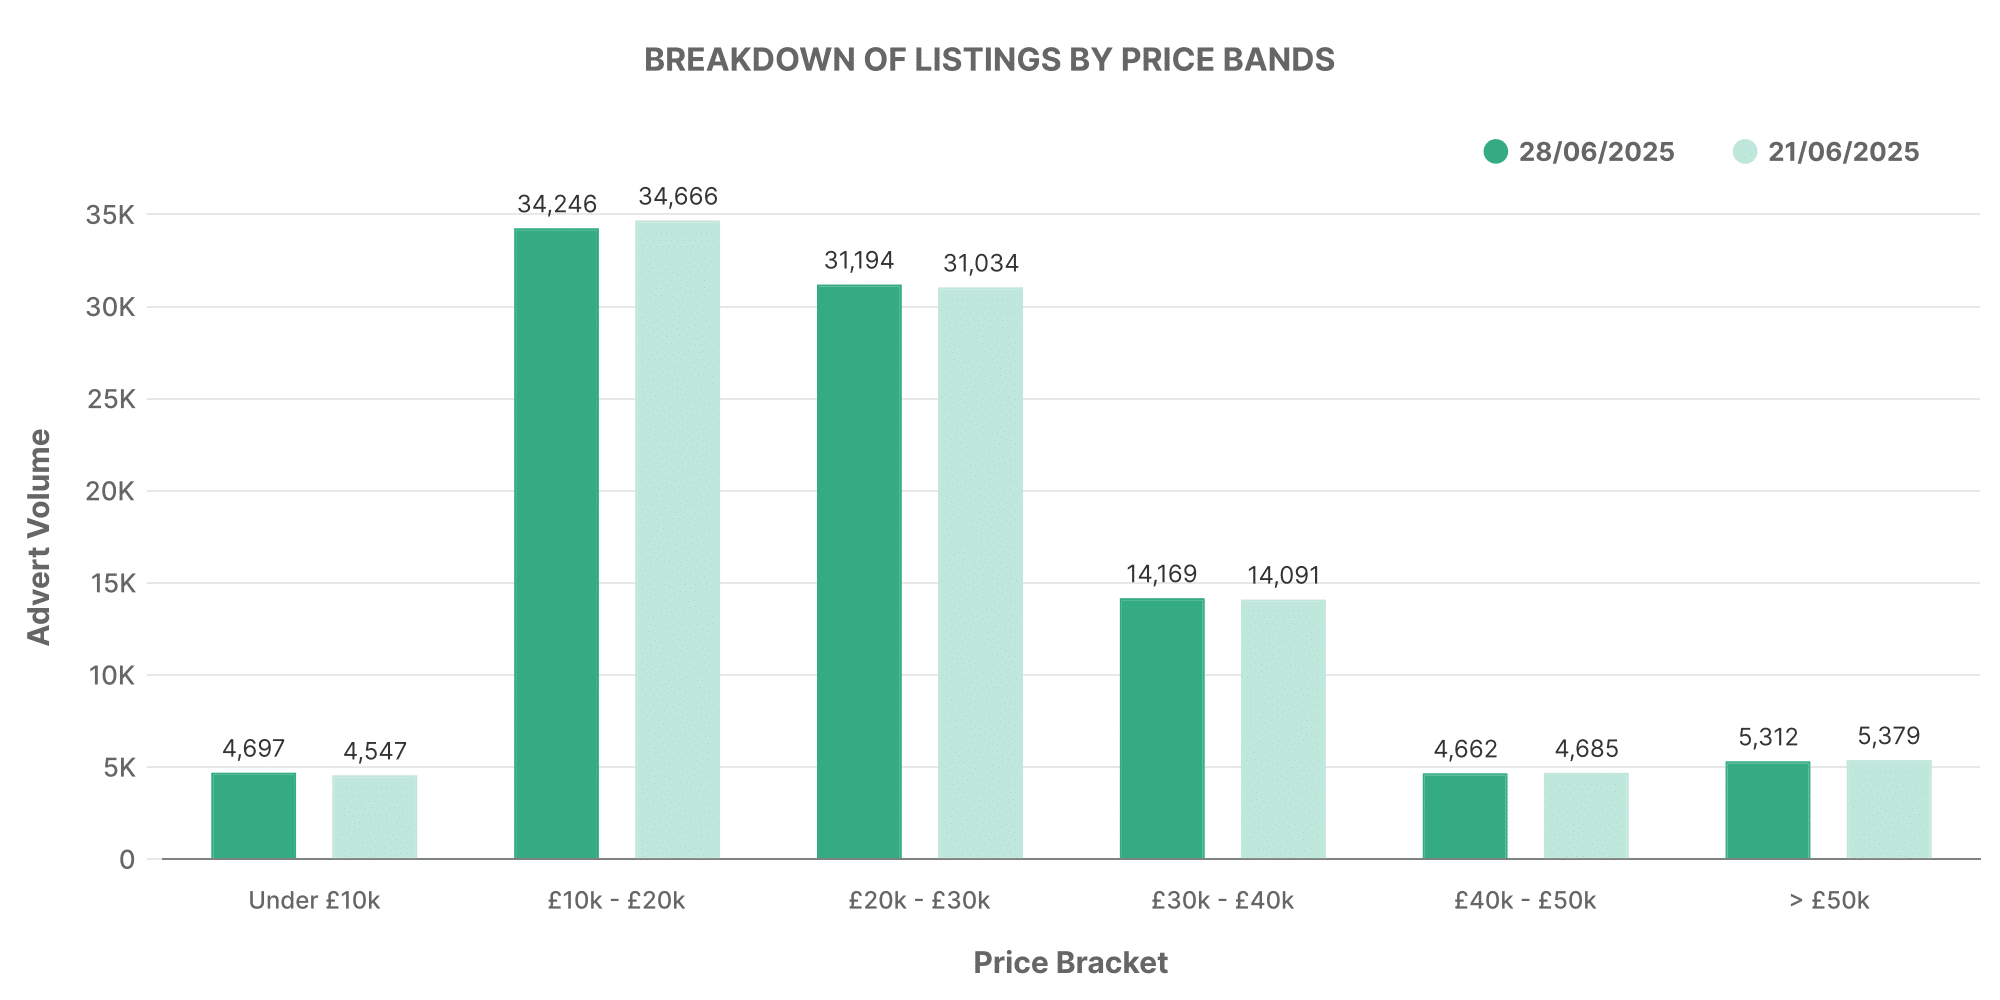
This image presents a snap of EV’s price band volumes. Similar to ICE cars, the majority of EV listings fell within the £10,000 – £20,000 bracket, followed by the £20,000 – £30,000 price range, with an average price of approximately £26,283.
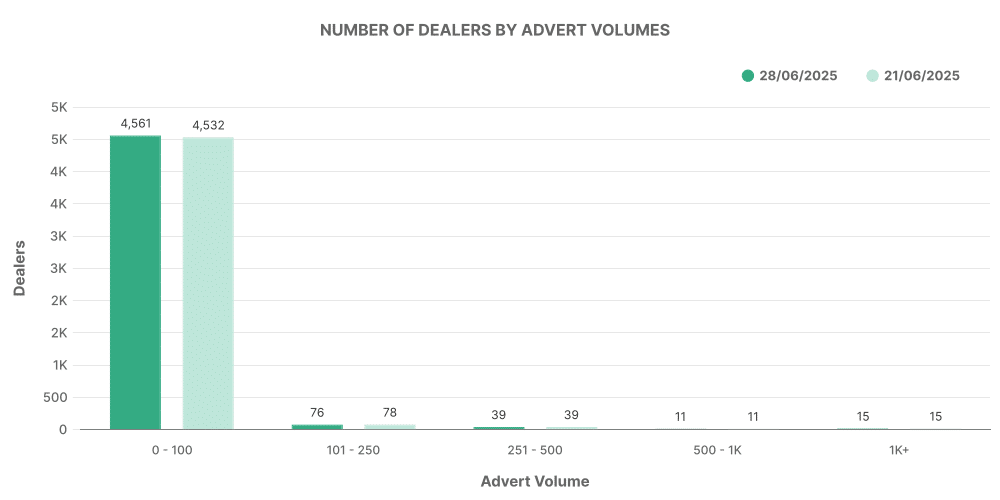
Analysing dealership volumes, it’s visible that most dealerships listed between 0-100 vehicles, indicating the relative novelty of this market compared to ICE vehicles.
Top 100 Dealers for EV Cars
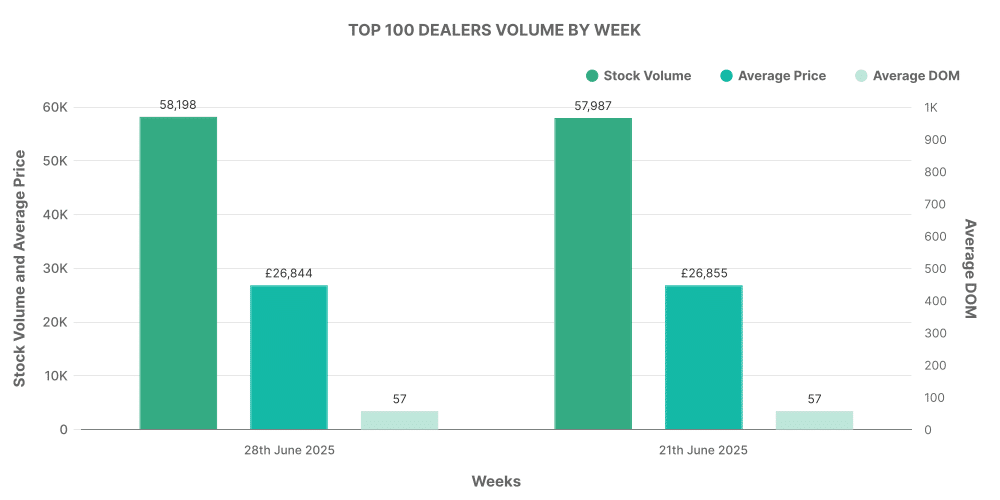
According to the image presented, the top 100 dealers accounted for almost 18% of the entire EV listing volume, with average prices slightly higher than the market average.
Comparing ICE and EV Markets
Diving further into this data, we can shed light on interesting conclusions. The ICE market still dominates with a total of 84.36% of the full listings, while EVs hold a significant 15.64%. However, the average price of EVs (approx £26,283) is noticeably higher than their ICE counterparts(around £18,620).
The analysis of the top 10 dealerships by listing volume for both EVs and ICE vehicles offers additional insight. For EVs, Toyota models like the Yaris and C-HR dominate, along with KIA’s Niro and Sportage. Interestingly, the Tesla Model 3 makes an appearance as well. On the other hand, in the ICE market, brands and models diversify, stating the established nature of this market.
