Our analysis explores the momentum in the UK weekly used car market data in detail, with a focus on internal combustion engine vehicles (ICE) and a keen eye on the expanding influence of the electric used car market (EV).
The Emerging Dominance of Electric Vehicles in the Used Car Market
Electric used cars have seen steadfast market penetration, signalling a notable consumer shift. Rounding off the week of 26th July 2025, various noteworthy factors have emerged from the dynamic landscape of the used EV market.
A total of 93,770 pre-owned electric cars were advertised for sale by 4,793 dealers throughout this week.
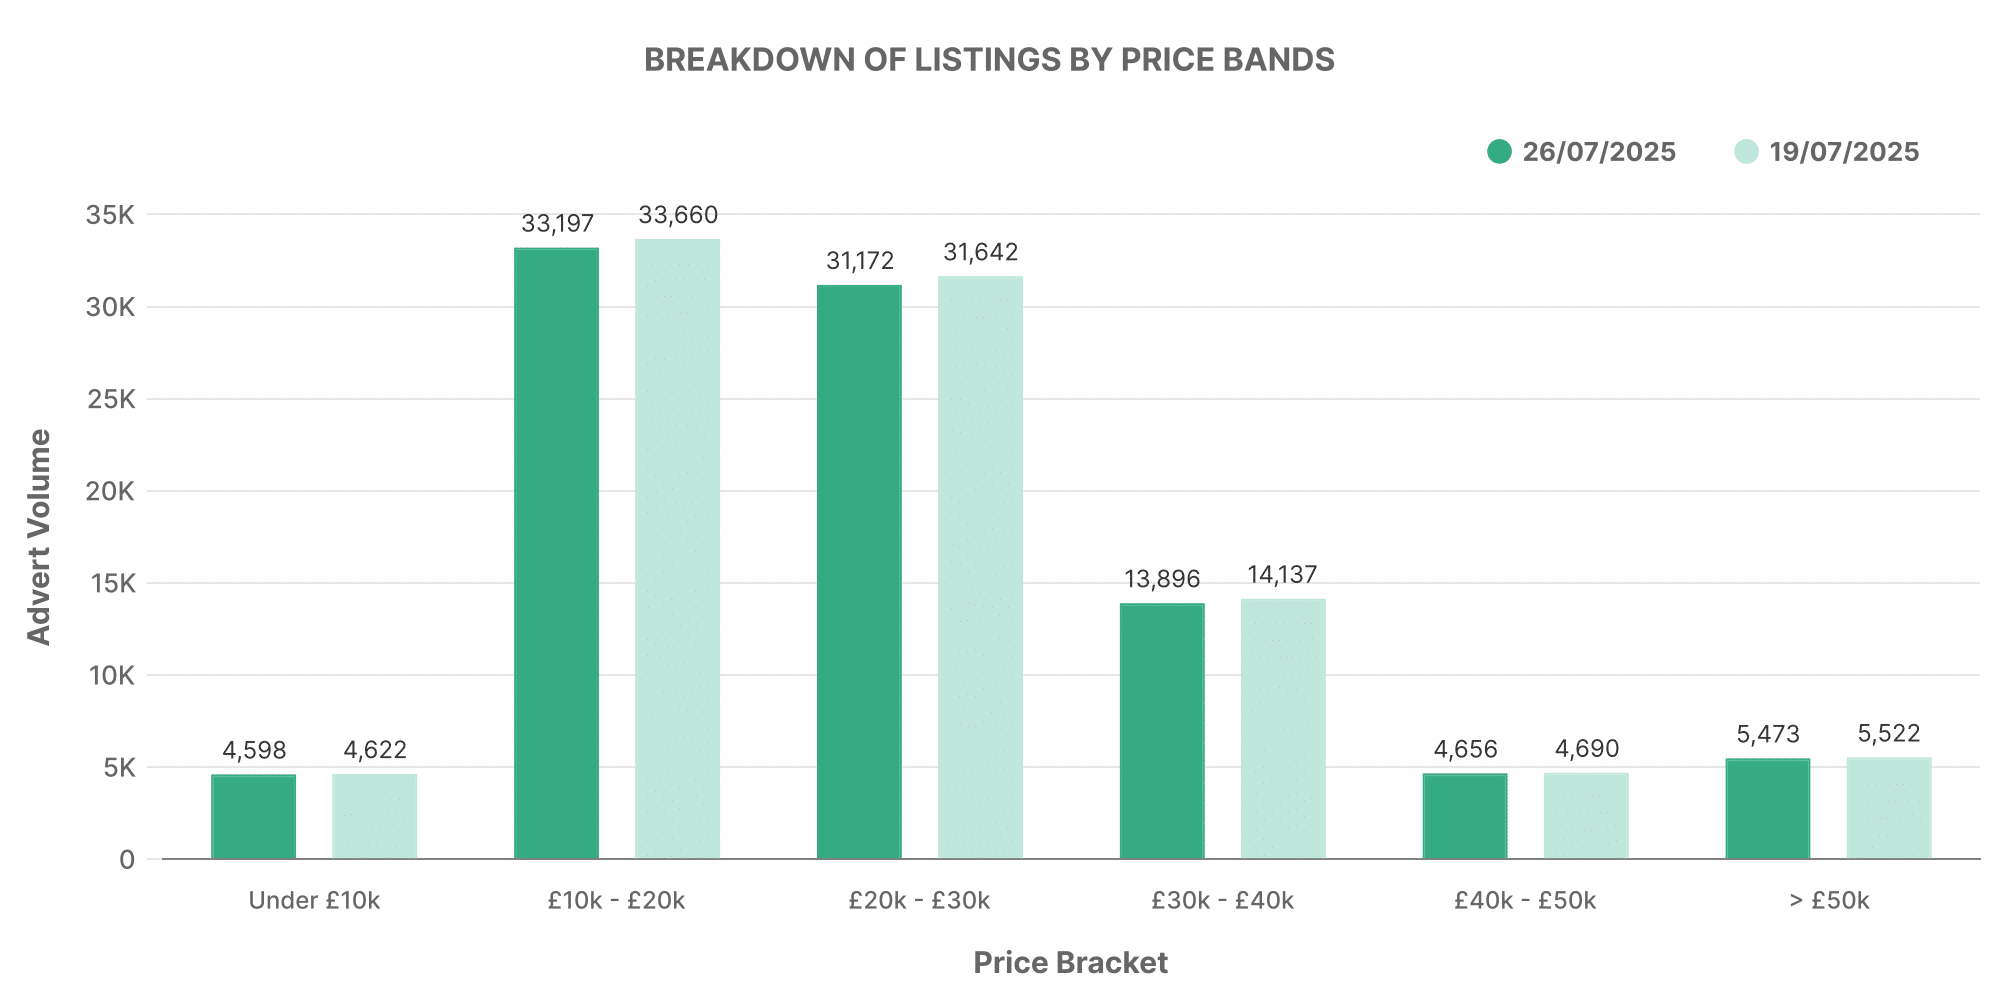
The graph displays the distribution of electric used car listings across different pricing bands. The most listed EVs fell between the £10,000 – £20,000 price bracket, followed by vehicles in the £20,000 – £30,000 category. Interestingly, luxury models priced above £50,000 are also permeating the market, representing the increasing diversity of the used EV market.
Turning our attention to traditional Internal Combustion Engine vehicles (ICE), the week witnessed listings of 601,946 used ICE cars circulated by 10,554 dealers.
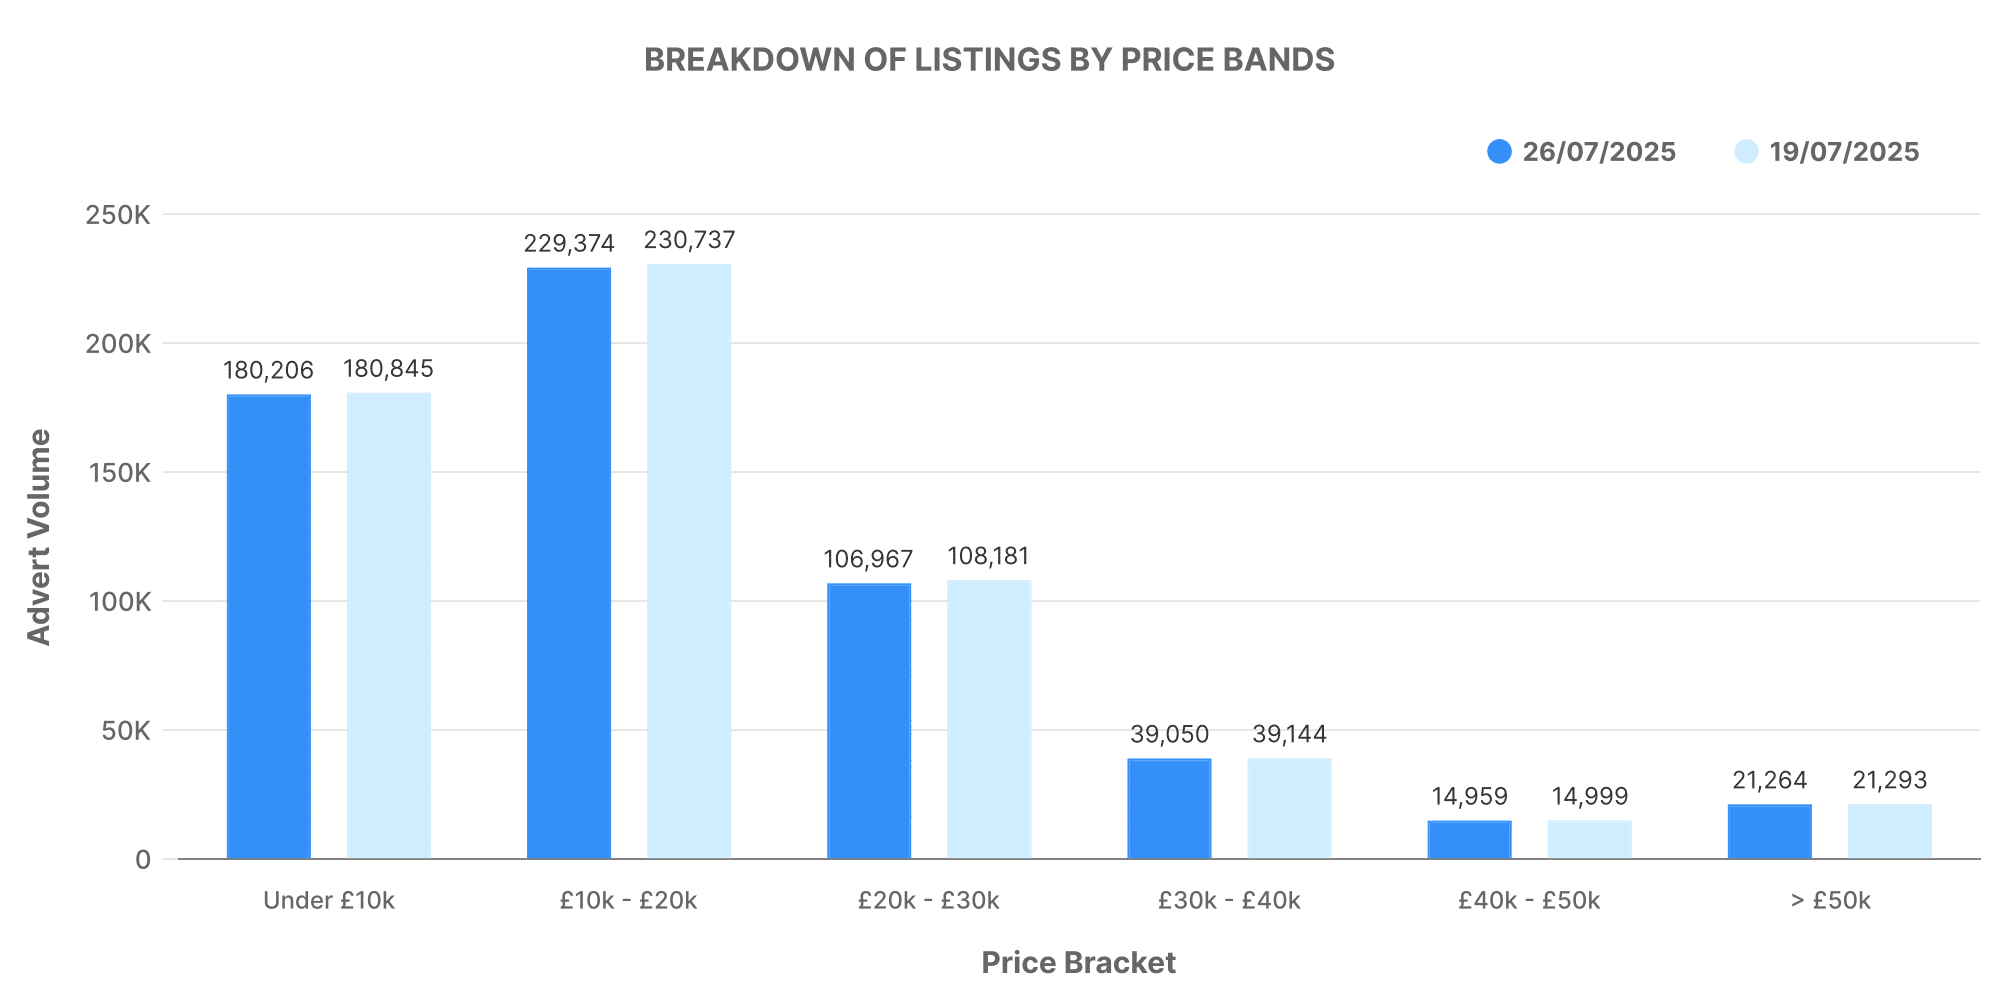
When it comes to ICE vehicles, the bulk of the cars were priced in the £10,000 – £20,000 range, similar to EVs. However, the average price of ICE cars listed (£18,786) was considerably less than the average asking price for EVs (£26,505).
Dealer Volume Decoded
A deeper understanding of dealer volumes can foster clarity on the used car market.
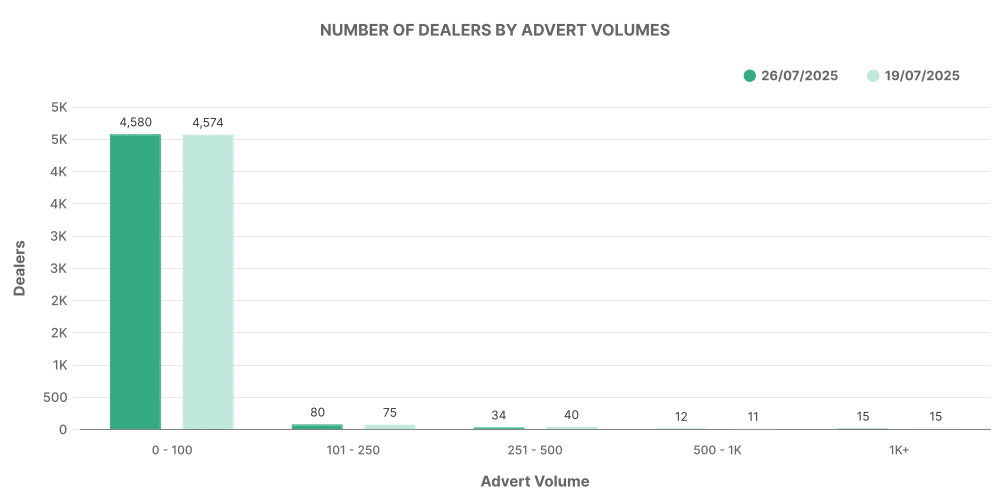
In the case of EVs, the majority of dealers partook in listing between 0-100 vehicles, indicating the relatively fledgling nature of this market.
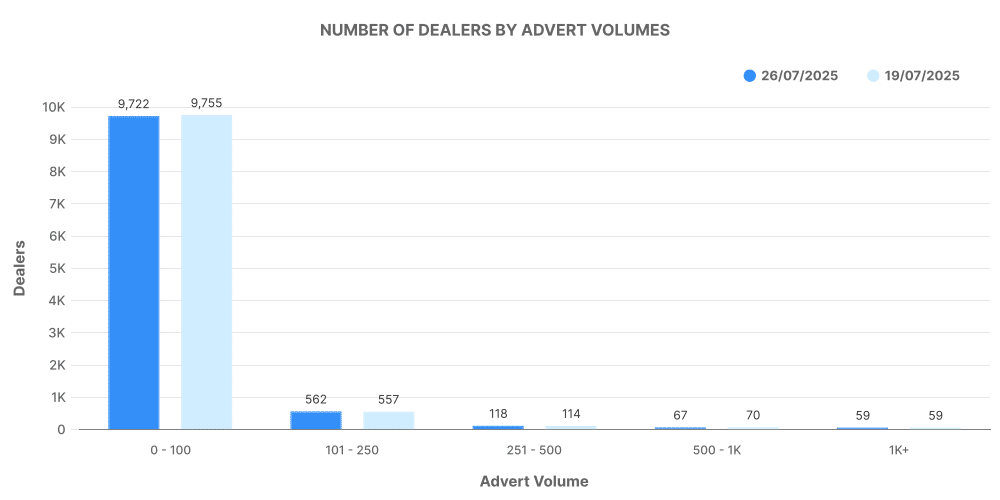
Conversely, for ICE vehicles, dealers showcased a more evenly distributed range of volumes, highlighting a mature market where dealerships of all sizes partake.
The Top 100 Dealers: ICE vs EV
The following analysis unveils an intriguing comparison of the top 100 dealerships by volume for both electric and conventionally fuelled used cars.
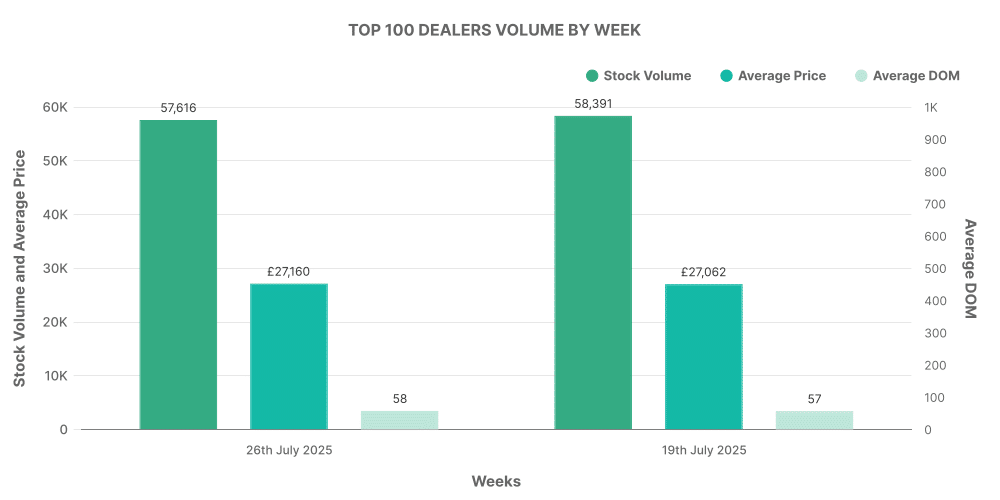
The top 100 electric dealers accounted for 61% of all EV listings, with their average selling price slightly higher than the market average.
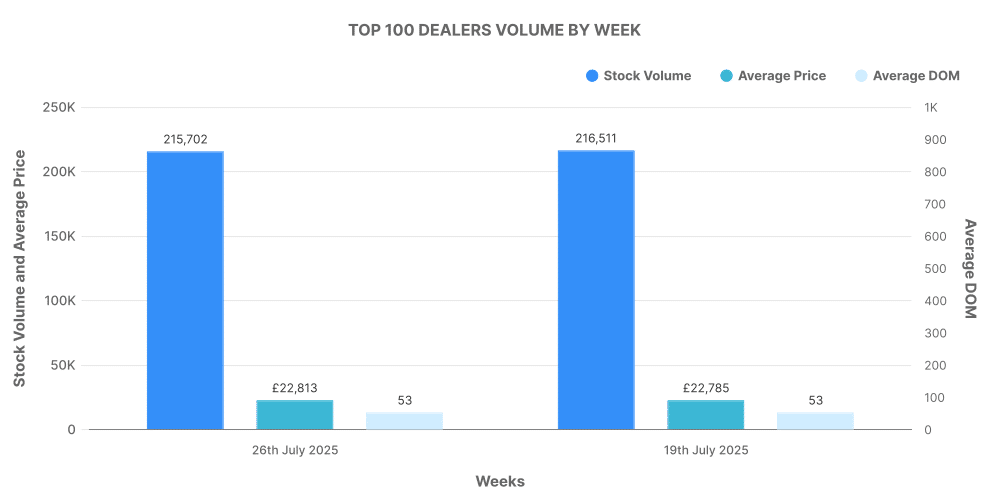
On the contrary, the top 100 ICE dealers accounted for 36% of total listings, with their cars also listed at prices higher than the average market price.
Comparison: ICE vs EV
In terms of percentage share, while electric vehicles (EVs) accounted for 15.58% of total used car listings, internal combustion engine vehicles (ICE) were notably higher at 84.42%. Although still significantly outnumbered by ICE vehicles, EV presence continues to grow on the back of increasing consumer environmental awareness and government incentives for greener mobility choices.
The average selling price of EVs continues to be more than ICE cars, at £26,505 compared to £17,386 respectively. This difference can be attributed to a mix of factors including tax incentives, lower running costs, and long-term value for money.
The most listed EV model was the Toyota Yaris, seeing 4,811 listings in the week, followed by the Toyota C-HR and the KIA Niro with 3,167 and 2,878 listings respectively. This data is crucial for automotive market insights and UK car price trends.
