Understanding the shifts in the used car market matters for automotive dealers, lenders, insurers, investors and auction businesses. A clear picture of pricing, volumes and dealer behaviour helps shape better commercial decisions. This month’s analysis examines both internal combustion engine (ICE) vehicles and the electric used car market, with a focus on UK car price trends and automotive market insights.
Overview of the used car market
The UK used car market remained strong throughout August 2025, with over 814,000 vehicles listed across 10,834 dealers. This figure reflects the depth of supply and the ongoing resilience of the sector.
- Total listings: 814,636
- Dealers advertising stock: 10,834
- Average days on market (DOM): 75
- Average listed price: £18,261
The breadth of supply across dealers and rooftops underlines the continued liquidity of the market. Inventory turnover times remained stable at 75 days, reflecting balanced retail demand and pricing discipline across the sector.
Price band distribution – ICE vehicles
Graph data shows a consistent spread across the core pricing brackets:
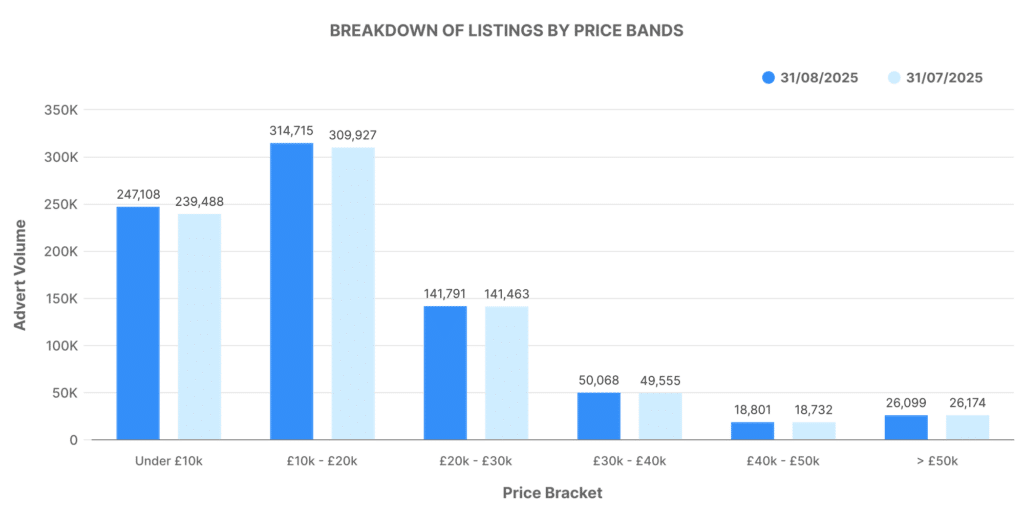
- £0 – £10,000: 247,108 listings
- £10,000 – £20,000: 314,715 listings
- £20,000 – £30,000: 141,791 listings
- £30,000 – £40,000: 50,068 listings
- £40,000 – £50,000: 18,801 listings
- £50,000+: 26,099 listings
The largest share sits in the £10,000 – £20,000 range, reflecting the affordability sweet spot for the mass market. Vehicles under £10,000 continue to play an important role, with more than 247,000 cars listed in this price band. Higher-end stock (£50,000+) retained presence with over 26,000 vehicles advertised, indicating continued appetite for premium cars among UK buyers.
Dealer inventory volumes – ICE vehicles
Dealer activity demonstrates the spread of stock control across different sized businesses:
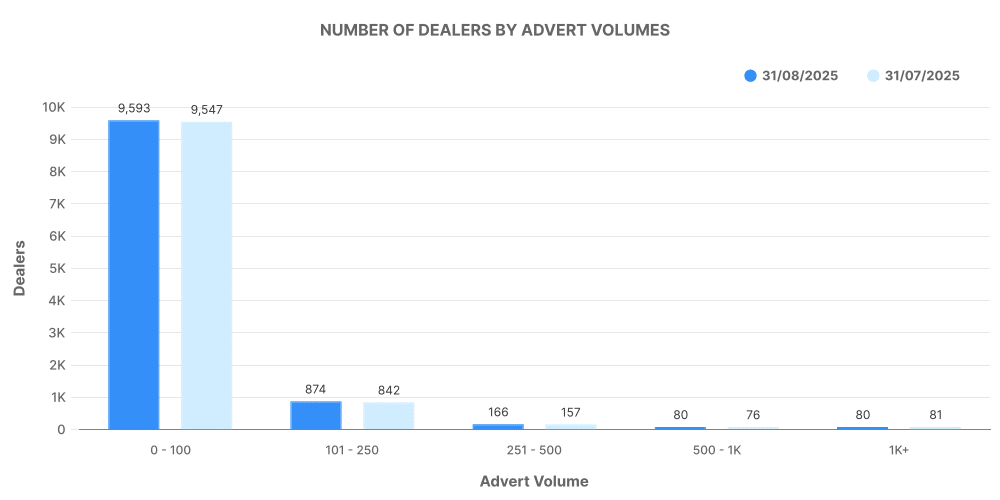
- 0–100 vehicles: 9,593 dealers
- 101–250 vehicles: 874 dealers
- 251–500 vehicles: 166 dealers
- 500–1,000 vehicles: 80 dealers
- 1,000+ vehicles: 80 dealers
This distribution shows that the majority of ICE dealers remain in the lower volume bands, often reflecting independent retailers and smaller franchises. Larger groups, while fewer in number, still hold significant influence over total advertised stock, contributing scale to the market.
Top 100 ICE dealers
The top 100 dealers accounted for 304,637 vehicles, representing more than one third of all ICE listings. Their pricing sits above the wider market, with an average advertised price of £22,036.
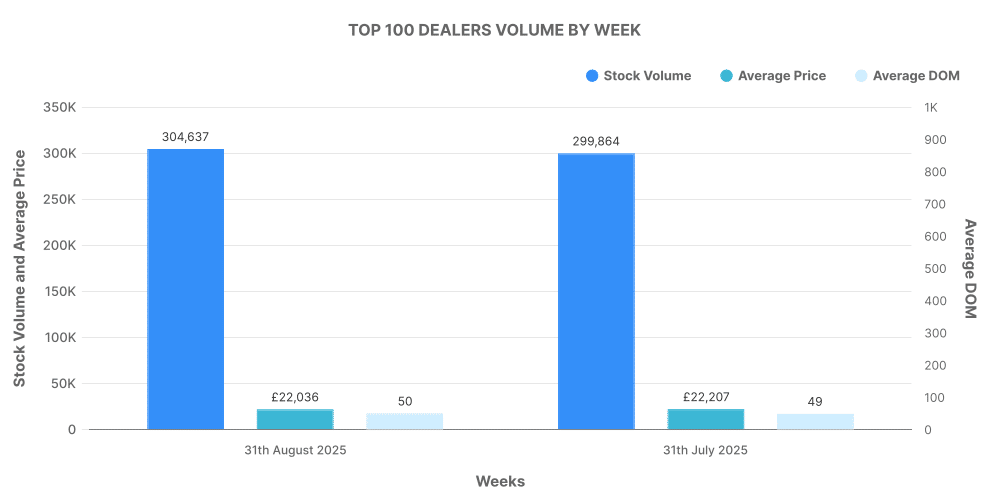
- Top 100 stock volume: 304,637
- Average DOM: 50 days
- Average price: £22,036
- Price increases: 108,495
- Price decreases: 359,107
Dealers outside the top 100 listed 509,999 vehicles, with lower average pricing at £15,946 and longer selling times at 89 days. The contrast highlights the greater efficiency and stronger margins achieved by the largest retail groups.
The electric used car market
The electric used car market continues to hold steady, contributing a significant proportion of listings each month. August 2025 closed with 125,223 EVs advertised by 5,246 dealers.
- Total EV listings: 125,223
- Dealers advertising EVs: 5,246
- Average DOM: 66
- Average listed price: £25,720
The data shows consistent consumer interest in second-hand EVs, with stock turning slightly quicker than ICE vehicles and maintaining a higher average price point.
Price band distribution – EVs
The electric used car market shows a distinct spread in pricing, with strong activity across the £10,000 – £30,000 range:
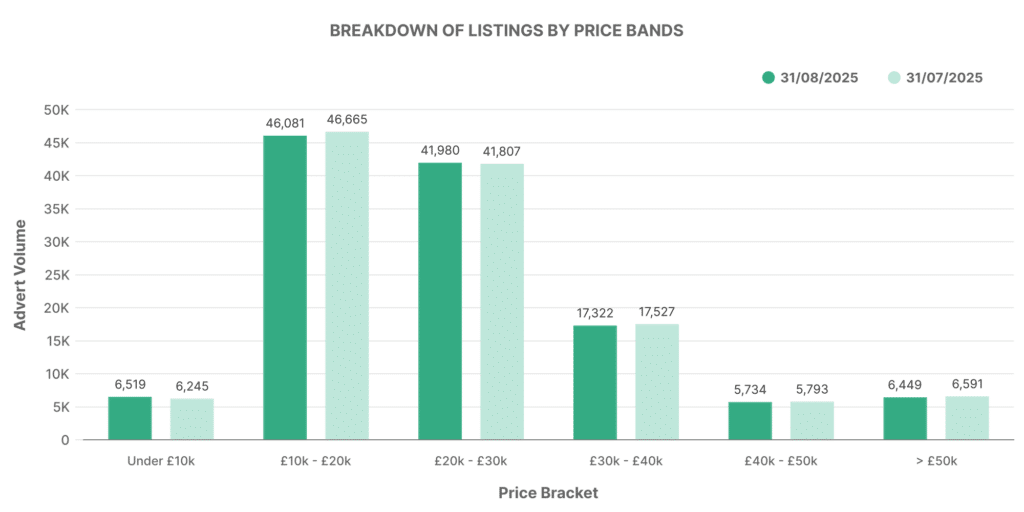
- £0 – £10,000: 6,519 listings
- £10,000 – £20,000: 46,081 listings
- £20,000 – £30,000: 41,980 listings
- £30,000 – £40,000: 17,322 listings
- £40,000 – £50,000: 5,734 listings
- £50,000+: 6,449 listings
The £10,000 – £20,000 band carried the largest share, with more than 46,000 vehicles, closely followed by the £20,000 – £30,000 range at nearly 42,000 listings. This split reflects growing affordability in the used EV market, supporting buyers seeking accessible entry points to electric ownership.
Dealer inventory volumes – EVs
Stock distribution among EV dealers mirrors the structure seen in ICE but on a smaller scale:
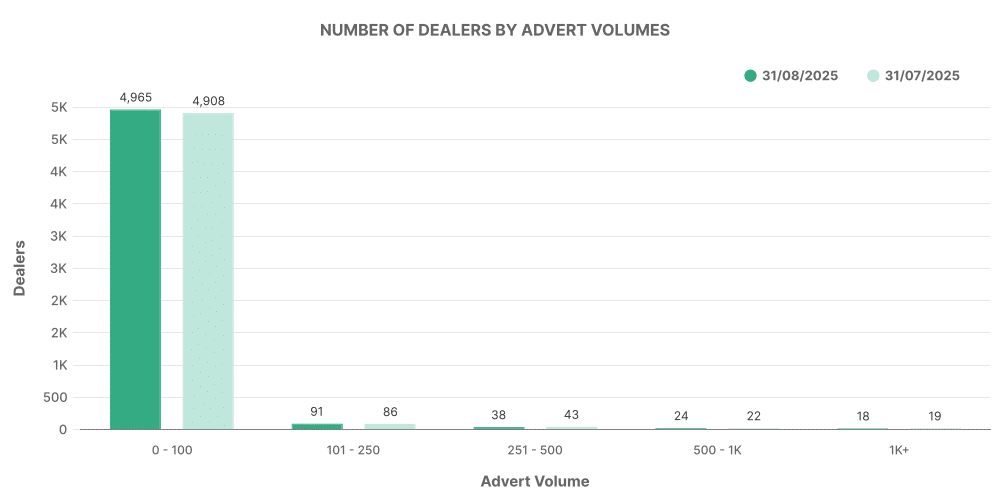
- 0–100 vehicles: 4,965 dealers
- 101–250 vehicles: 91 dealers
- 251–500 vehicles: 38 dealers
- 500–1,000 vehicles: 24 dealers
- 1,000+ vehicles: 18 dealers
Most EV dealers continue to hold fewer than 100 vehicles, underlining the relatively early stage of this market compared with ICE. Larger volume dealers are emerging, but the spread indicates a market still building its structural foundations.
Top 100 EV dealers
The top 100 EV dealers accounted for 78,077 vehicles, more than 62% of all EV listings. This level of concentration shows that scale players are driving the electric market forward.
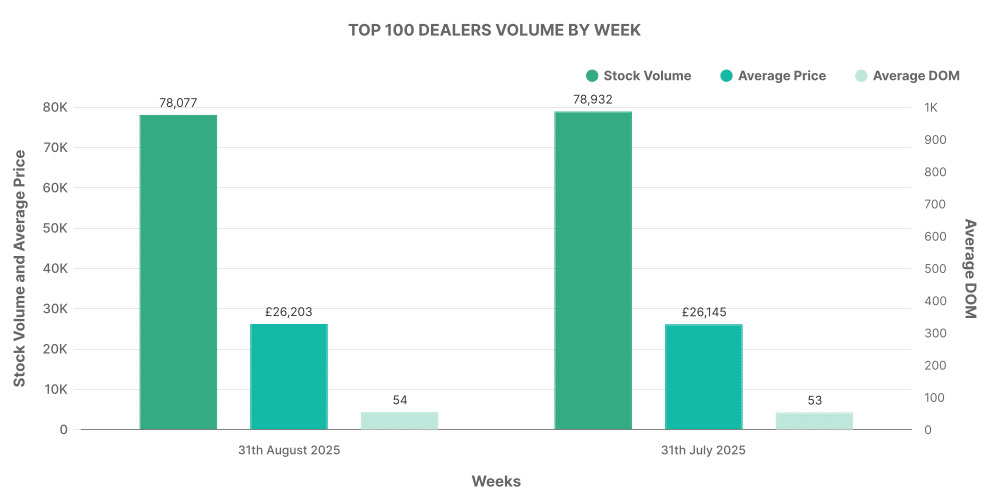
- Top 100 stock volume: 78,077
- Average DOM: 54 days
- Average price: £26,203
- Price increases: 26,352
- Price decreases: 91,963
Dealers outside the top 100 advertised 47,146 vehicles, with lower pricing (£24,912 average) and slightly longer selling times at 84 days. The performance of the top 100 again highlights the commercial advantage of scale in this developing sector.
EV share of the used car market
When viewed against the total market, EVs accounted for 15.37% of all used car listings in August 2025, compared with ICE vehicles at 84.63%.
- EV share of listings: 15.37%
- ICE share of listings: 84.63%
- Average EV price: £25,720
- Average ICE price: £16,889
This comparison shows that EVs are commanding an £8,831 premium over ICE vehicles. Average days on market for EVs were also nine days shorter, reflecting stronger turnover for electric stock compared with traditional engines.
UK car price trends – ICE vs EV
- ICE vehicles averaged £18,261, lower than the EV average.
- EVs averaged £25,720, reflecting both higher technology costs and stronger demand from buyers moving towards electrification.
- ICE stock took 75 days to sell, compared with 66 days for EVs.
The difference in pricing and stock movement highlights the divergence between the two markets. EVs are maturing quickly, building share and demonstrating stronger demand dynamics.
Automotive market insights
Key observations from August 2025 data:
- The used car market remains broad-based, with over 814,000 vehicles offered and dealer participation above 10,800.
- The electric used car market continues to expand, with over 125,000 EVs listed and representing more than 15% of total listings.
- EVs command higher average prices and faster turnover, showing a strong appetite from buyers.
- Dealer scale remains a strong differentiator, with the top 100 dealers achieving faster sales and stronger average prices across both ICE and EV markets.
These insights show that the UK used car market is adapting to changing buyer expectations while maintaining strong liquidity across all vehicle types. For businesses engaged in finance, insurance, or remarketing, this data offers a benchmark for risk analysis and strategic planning.
