Understanding the shifts and patterns in the used car market remain a prime concern for all businesses involved with the automotive sector. Observing these trends can help companies amplify their strategies and better plan for growth. Today’s report will delve into the data surrounding the used car market in the UK, focusing not only on the conventional internal combustion engine vehicles (ICE) but also shedding light on the increasingly significant electric used car market (EV).
Traditional Car Market (ICE)
The week ending on the 4th October saw a total of 602,297 used ICE listings, distributed among 10,453 dealerships. This is indicative of a relatively steady state in the ICE market, maintaining its resilience in the industry.
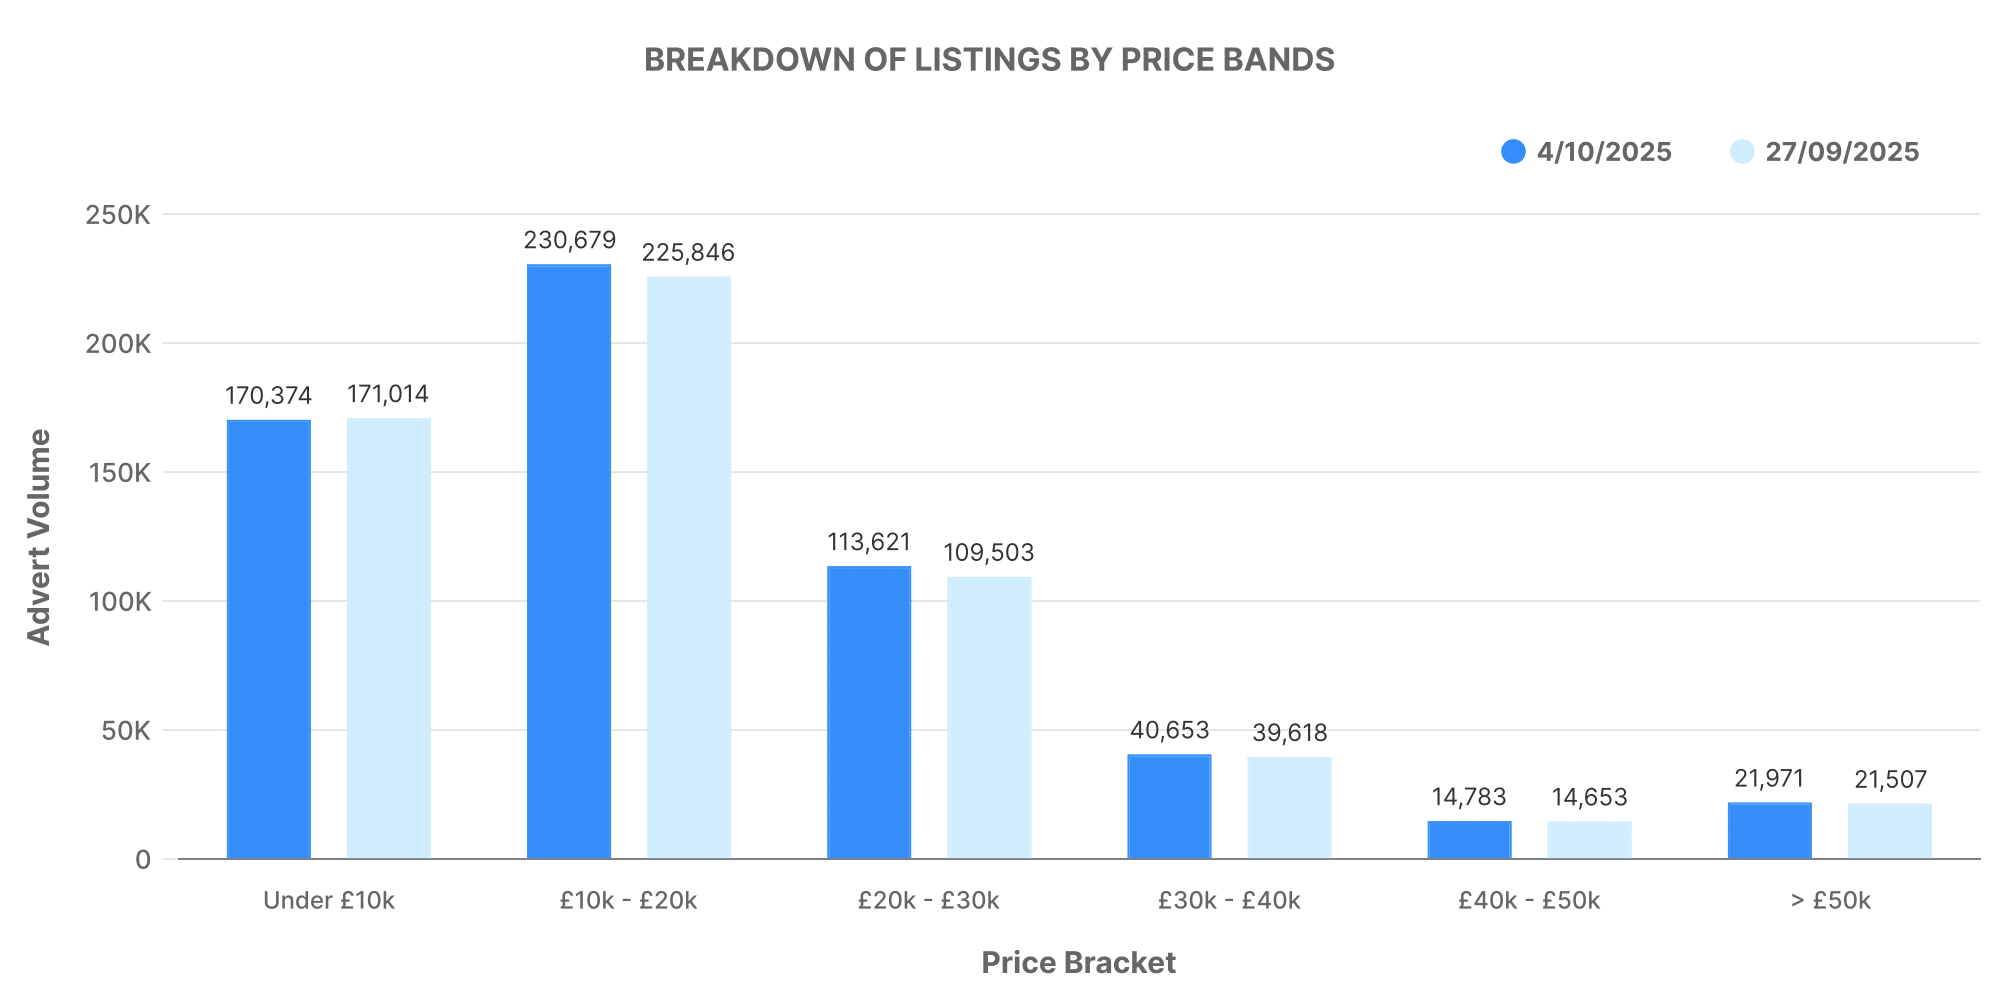
Breaking down these listings by price bands, the majority of listed ICE vehicles fell within the £10,000 – £20,000 range, closely followed by those in the £20,000 – £30,000 bracket. Luxury models with a price tag exceeding £50,000 also added to the market’s versatility.
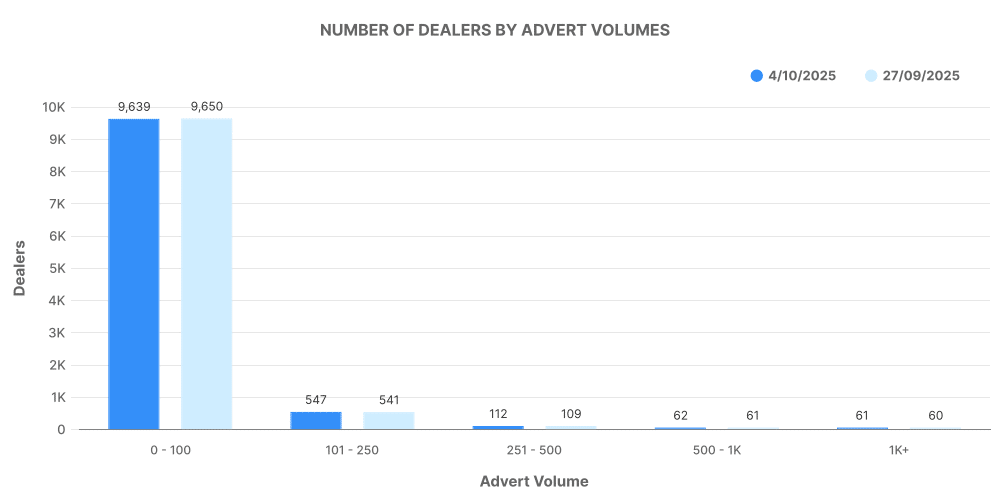
An exploration into dealership volumes reveals that listing volumes were evenly spread amongst dealers, displaying the well-established and balanced nature of the ICE market.
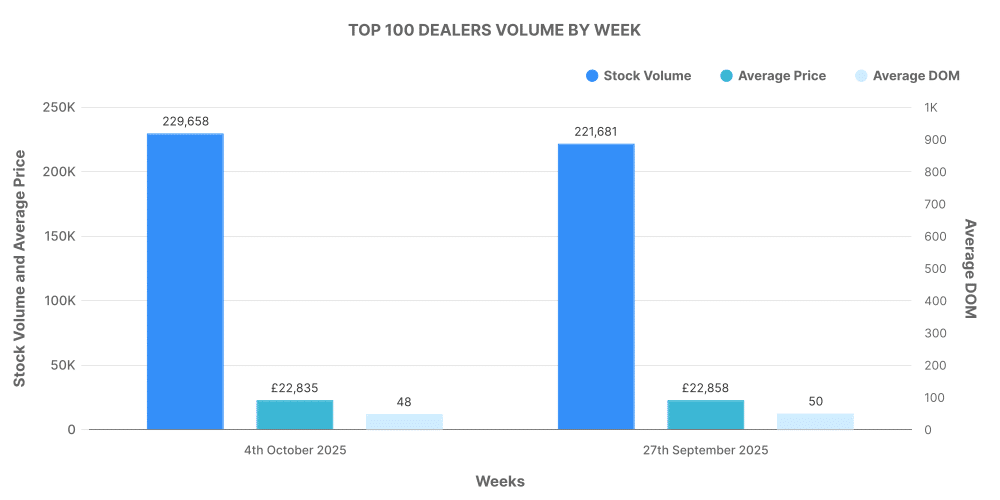
Furthermore, the top 100 dealerships accounted for an impressive 38% of the total ICE listings, keeping average prices competitive at around £22,835.
Electric Car Market (EV)
Moving on to the increasingly significant arena of electric vehicles, the EV market saw a total of 93,027 used EV listed by 4,652 dealers for the week ending on the 4th October.
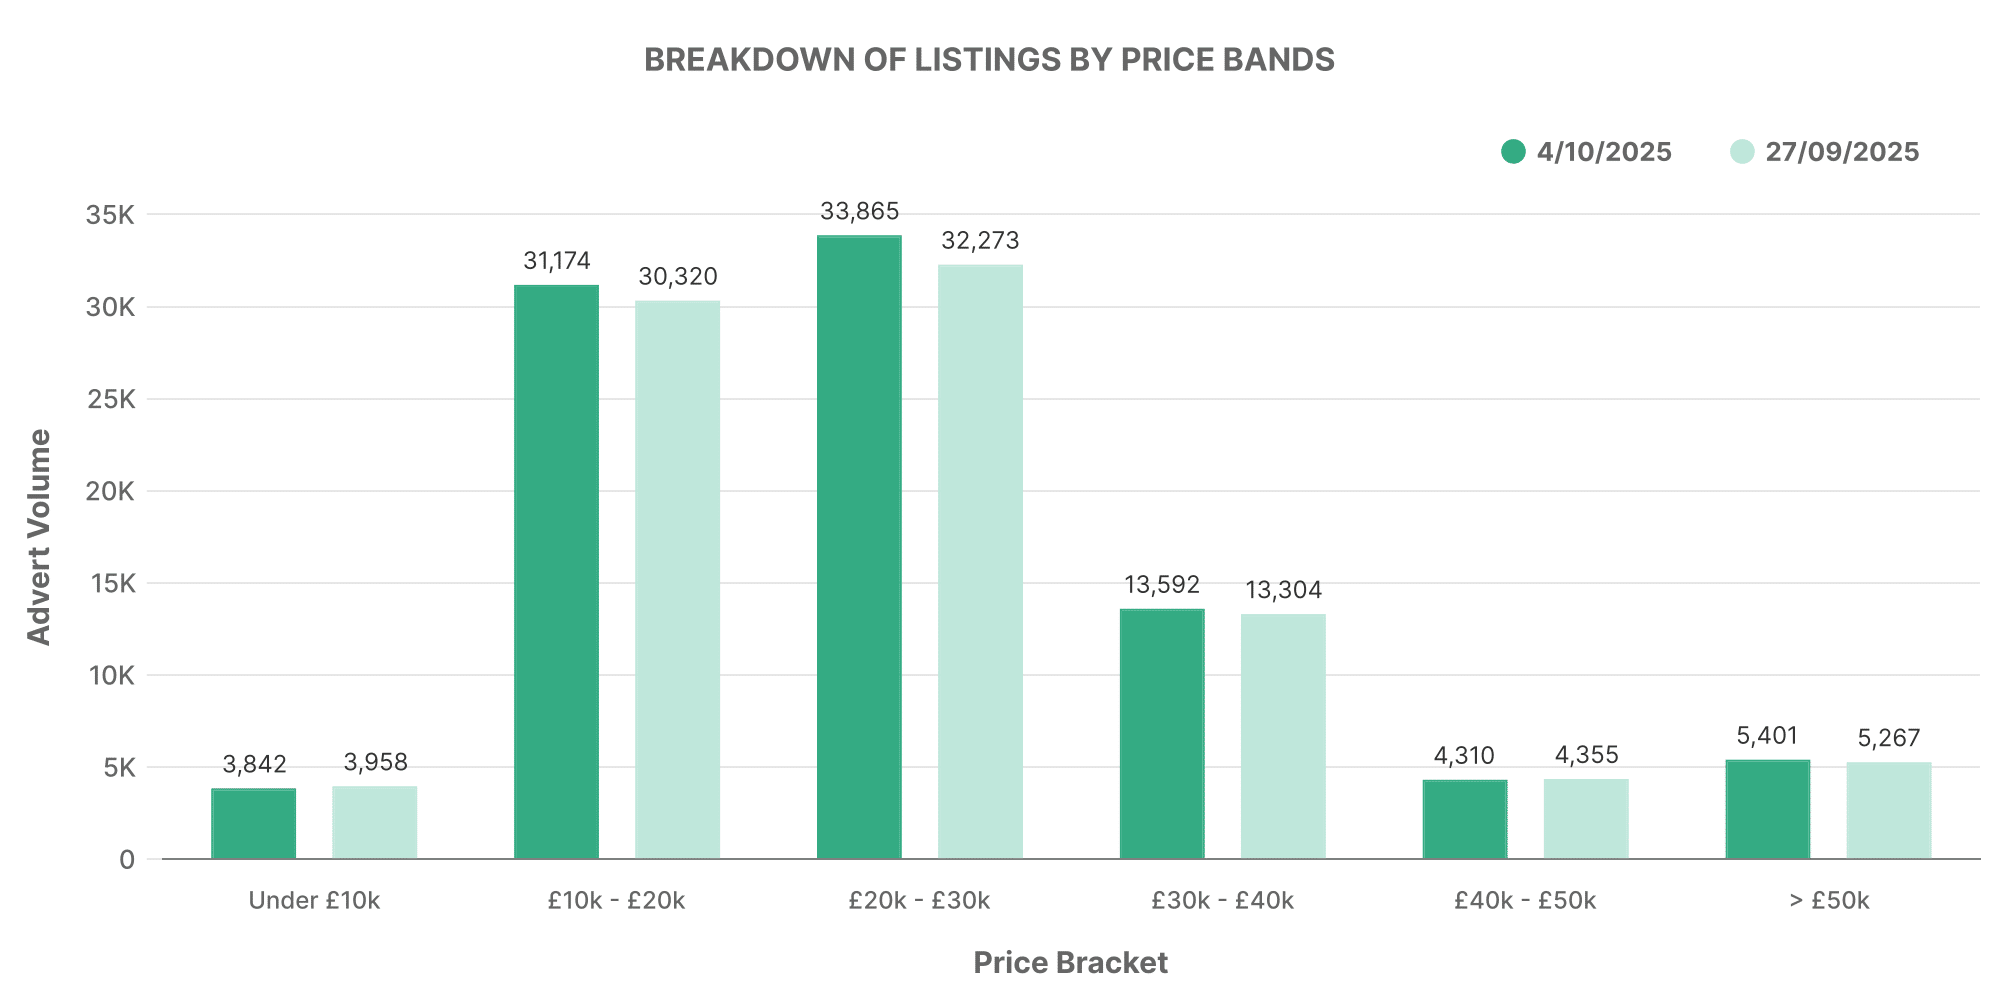
Breaking down the EV price bands, we see a similar pattern to the ICE market, with a higher concentration of EVs in the £10,000 – £20,000 range. However, the average prices of listed EVs were marginally higher, demonstrating the premium often associated with electric vehicles.
In the realm of dealership volume, most dealerships had between 0 – 100 vehicles listed, a prime indicator of the relative novelty of this market compared to ICE vehicles.
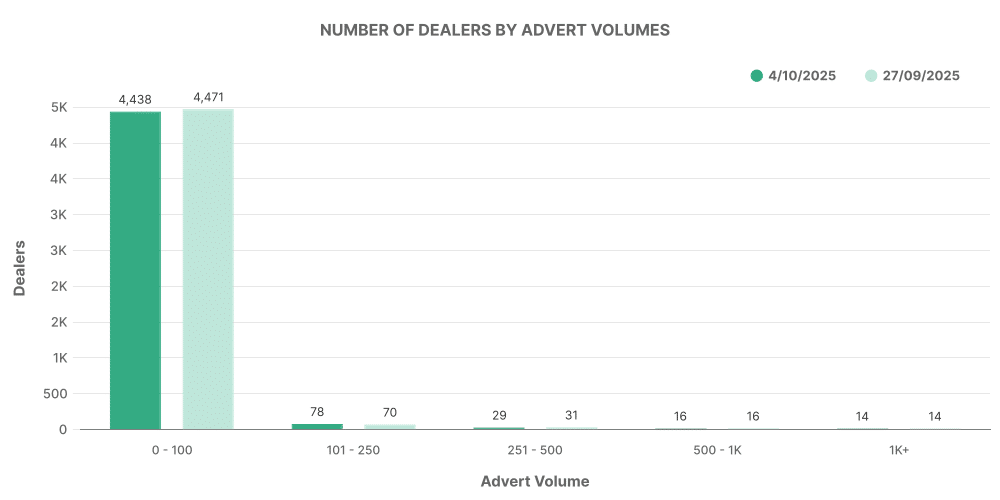
In comparing the top 100 dealerships by listing volume for both EVs and ICE vehicles, an interesting pattern emerges. The top 100 dealers account for an impressive 62% of total EV listings, with an average price slightly above the overall market average.
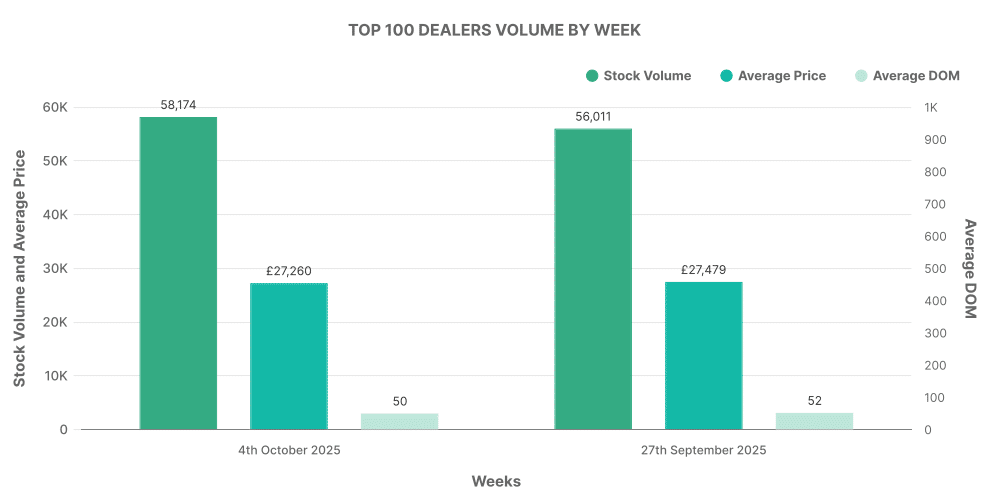
This comparison between ICE and EV markets gives insights into the evolving preferences of the UK used car industry, as electric vehicles continue to solidify their importance.
Comparison: ICE vs EV
Comparing both markets, we notice that while ICE remains dominant in total volume, EVs are marking their presence with a significant 15.45% of total listings. This figure is up from 15.23% in the previous week, reflecting the changing dynamics of the industry and aligning with wider trends towards more sustainable modes of transport.
In terms of average price, EVs came out on top, registering an average of £26,716 compared to the ICE average of £19,129. This underlines the fact that while EVs are growing in popularity, they still command a price premium over their ICE counterparts.
*includes electric vehicles, petrol hybrids and diesel hybrids.
