Understanding the shifts in the used car market helps dealers, insurers, lenders and investors spot patterns that shape future strategies. Using Marketcheck UK’s real-time and historical automotive data, this month’s analysis explores how the used car market performed through October 2025 — reviewing both internal combustion engine (ICE) and electric vehicle (EV) listings, dealer activity, and pricing trends.
The analysis brings together valuable automotive market insights that reflect how the UK car price trends continue to adapt to consumer demand, economic pressures, and supply-side changes.
Headline summary
In October 2025, the UK’s used car sector recorded 848,000 vehicle listings across both ICE and EV segments. Internal combustion models remained dominant, accounting for 799,625 listings (around 94%), while EVs represented just over 6% of total market listings with 48,272 vehicles recorded.
The month showed stability in stock volumes and pricing across most dealer groups, with a steady average used car price of £18,773 for ICE vehicles and £25,916 for electric models.
The used car market (ICE) – October 2025
Overall market activity
In October, 10,676 dealers listed a combined total of 799,625 vehicles, a marginal 0.4% increase from the previous month. The average days on market (DOM) stood at 73 days, suggesting steady demand and stock rotation among retailers.
Average pricing for ICE vehicles reached £18,773, reflecting a slight rise of 0.6% from September. This continues the pattern of stabilisation seen across late 2025, with no dramatic price fluctuations as supply levels hold firm.
Breakdown of listings by price bands
The breakdown of October’s used ICE listings shows that most vehicles sat within the mid-market range, indicating consistent demand across affordable family and fleet models.
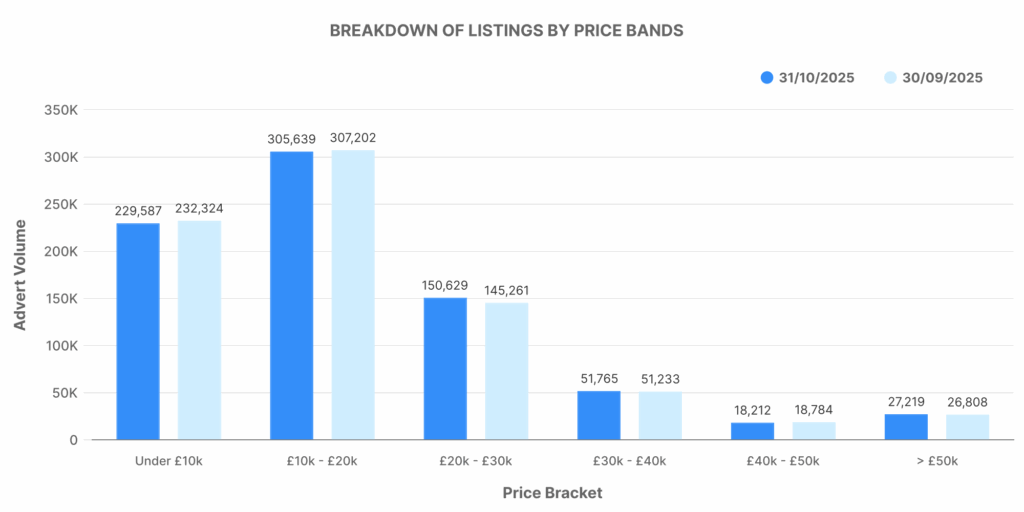
- £0–£10,000: 229,587 vehicles
- £10,000–£20,000: 305,639 vehicles
- £20,000–£30,000: 150,629 vehicles
- £30,000–£40,000: 51,765 vehicles
- £40,000–£50,000: 18,212 vehicles
- £50,000+: 27,219 vehicles
Most activity centred in the £10,000–£20,000 bracket, where buyers continue to find practical used options that align with current cost-of-living budgets. The volume of listings above £50,000 remained modest at 3%, representing the high-end and performance sectors.
The graph for this section highlights a clear mid-market bulge, showing that over half of the used car listings fall under £20,000. Vehicles priced between £10,000–£30,000 made up roughly 57% of the total ICE market, consistent with the segment’s long-term pricing pattern.
Number of dealers by advert volumes
Dealership size and stock distribution remained similar to previous months.
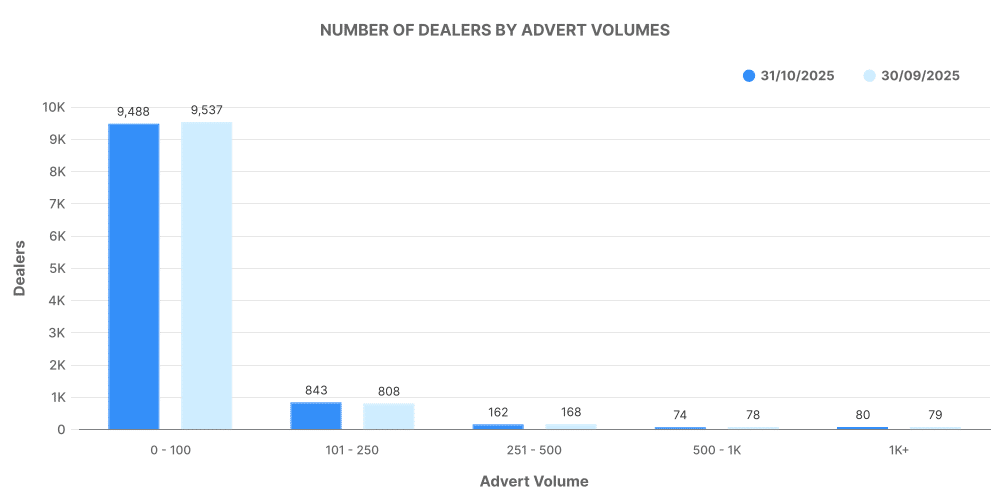
- 0–100 listings: 9,488 dealers
- 101–250 listings: 843 dealers
- 251–500 listings: 162 dealers
- 500–1,000 listings: 74 dealers
- 1,000+ listings: 80 dealers
The majority of used car dealers continue to operate with smaller stock volumes, highlighting the broad base of independent and single-site businesses that make up the UK’s used car ecosystem.
Analysis of top 100 dealers by volume
The top 100 ICE dealers accounted for 306,845 vehicles, equating to nearly 38% of all used car listings. These leading groups continued to influence pricing and visibility within the market.
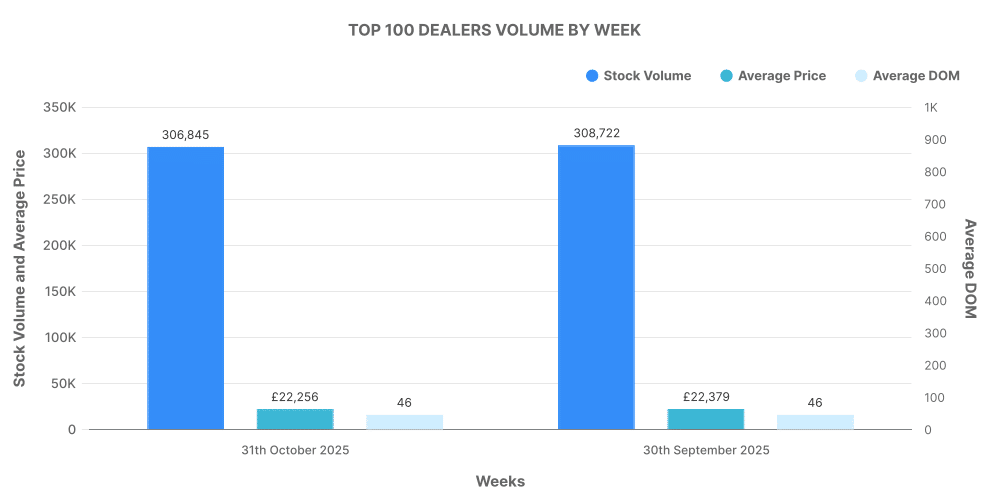
- Average DOM among the top 100: 46 days
- Average price: £22,256
- Recorded price increases: 90,063
- Recorded price decreases: 382,671
Compared with the broader market, top dealers turned stock faster — selling within an average of 46 days versus the market average of 73. This efficiency points to strong digital performance, well-priced stock, and repeat customer bases.
The electric used car market (EV) – October 2025
Market overview
The electric used car market recorded a total of 48,272 listings in October 2025, representing 6.04% of the total UK used car market. This figure highlights how EV stock volumes remain modest in comparison to combustion models but continue to form a noticeable niche.
Across 2,948 active EV dealers, the average EV price settled at £25,916, slightly lower than September’s £26,094. Average days on market (DOM) stood at 63 days, showing that used EVs continue to sell faster than traditional models.
Breakdown of electric listings by price bands
EV listings for October displayed a strong presence in the mid-range, where many second-hand electric hatchbacks and SUVs now compete.
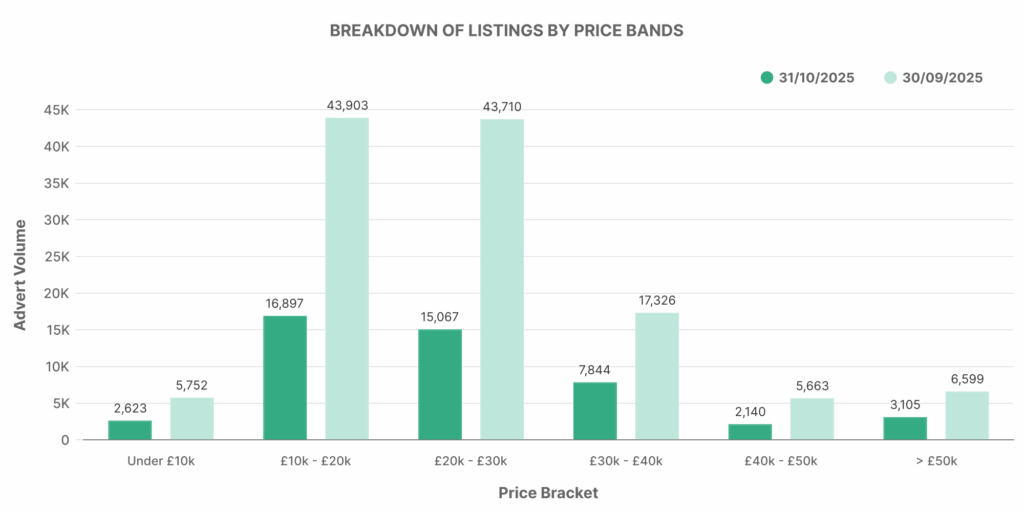
*September included electric vehicles, petrol hybrids and diesel hybrids, whereas October include electric vehicles only.
- £0–£10,000: 2,623 vehicles
- £10,000–£20,000: 16,897 vehicles
- £20,000–£30,000: 15,067 vehicles
- £30,000–£40,000: 7,844 vehicles
- £40,000–£50,000: 2,140 vehicles
- £50,000+: 3,105 vehicles
The majority of EVs sat within the £10,000–£30,000 range, highlighting increased affordability as more three- to five-year-old electric models re-enter the used market.
The EV price band graph shows a pronounced mid-market cluster, with nearly two-thirds of listings priced below £30,000. The smaller premium bracket above £50,000 includes recent models like the Porsche Taycan, Tesla Model Y, and Audi Q4 e-tron.
Number of EV dealers by advert volumes
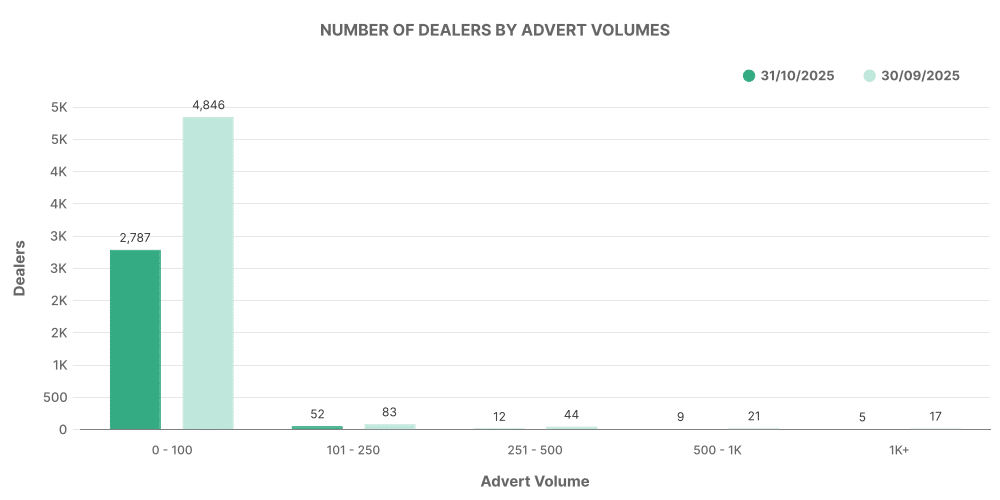
Electric car listings were spread across 2,948 active dealers, with most holding smaller inventory counts.
*September included electric vehicles, petrol hybrids and diesel hybrids, whereas October include electric vehicles only.
- 0–100 listings: 2,787 dealers
- 101–250 listings: 52 dealers
- 251–500 listings: 12 dealers
- 500–1,000 listings: 9 dealers
- 1,000+ listings: 5 dealers
The chart shows that the majority of EV dealers hold compact inventories, reflecting early adoption trends where only a handful of large groups manage significant EV volumes.
Analysis of top 100 EV dealers by volume
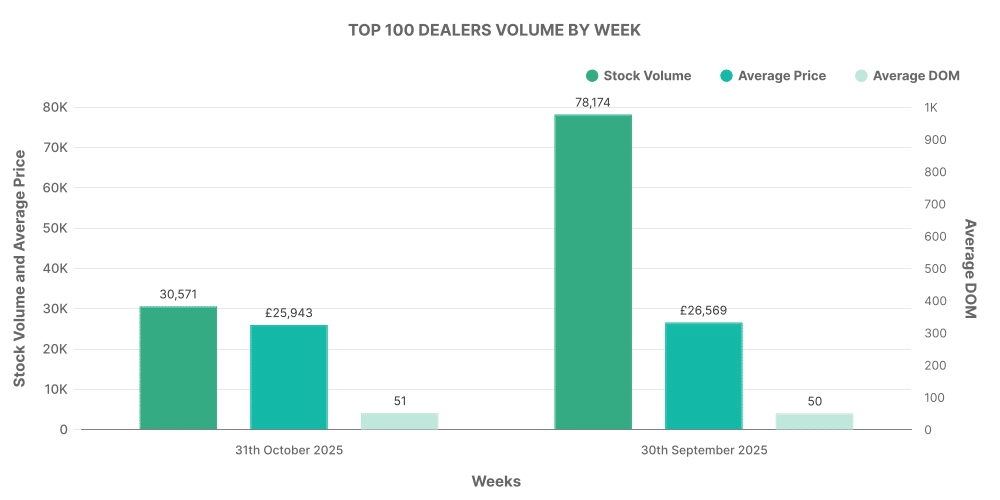
The top 100 EV dealers listed a combined 30,571 vehicles, or roughly 63% of all EV stock on the market. These groups play a central role in setting price perception and driving consumer trust in second-hand electric models.
*September included electric vehicles, petrol hybrids and diesel hybrids, whereas October include electric vehicles only.
- Average DOM among top 100: 51 days
- Average price: £25,943
- Price increases: 9,294
- Price decreases: 30,207
Compared to smaller EV dealers, top 100 groups displayed faster turnover and slightly higher pricing, indicating a stable and confident retail segment.
Top 10 advertised electric models
Electric listings across October were led by well-known brands that dominate the UK EV sector.
| Rank | Make and Model | Listings |
|---|---|---|
| 1 | Tesla Model 3 | 2,760 |
| 2 | Tesla Model Y | 1,807 |
| 3 | Nissan Leaf | 1,317 |
| 4 | Volkswagen ID.3 | 1,205 |
| 5 | Polestar 2 | 1,197 |
| 6 | Hyundai Kona | 1,150 |
| 7 | Audi Q4 e-tron | 1,080 |
| 8 | KIA Niro | 1,071 |
| 9 | Porsche Taycan | 1,058 |
| 10 | Jaguar I-Pace | 1,014 |
Tesla remains the standout performer, with the Model 3 leading listings once again. This confirms the brand’s dominance in both new and used electric markets. Meanwhile, strong representation from Hyundai, KIA, and Volkswagen reflects consumer confidence in mass-market EV options.
Comparing EV and ICE market performance
Market share
In October, electric vehicles accounted for 6.04% of the total used car listings, while internal combustion models made up 93.96%. The EV share fell from 15.6% in September as inventory tightened and dealer participation reduced.
This variation highlights the market’s fluid nature — where supply, residual values, and manufacturer incentives all influence the number of EVs entering second-hand channels each month.
Average prices
- Average ICE price: £18,773
- Average EV price: £25,916
The gap between the two remained consistent, with EVs priced around 38% higher than ICE equivalents. This difference reflects newer average vehicle age, battery technology costs, and the high proportion of premium-brand electric models.
As more three- to five-year-old EVs reach the used market, the price gap is expected to narrow gradually.
Dealer performance overview
The ICE sector continues to demonstrate greater breadth, with over 10,000 dealers actively trading. The EV market, by comparison, remains smaller and more concentrated, with 2,948 dealers in October.
Both segments show evidence of stable pricing and improved days-on-market performance, suggesting that consumer demand remains strong across both fuel types despite economic headwinds.
Summary of key market indicators – October 2025
| Metric | ICE Vehicles | Electric Vehicles |
|---|---|---|
| Total listings | 799,625 | 48,272 |
| Total dealers | 10,676 | 2,948 |
| Average days on market | 73 | 63 |
| Average price | £18,773 | £25,916 |
| Share of total listings | 93.96% | 6.04% |
Final insights
October’s used car market showed balance, predictability, and slow growth across dealer volumes. The mid-range segment (£10,000–£30,000) remained the cornerstone for both ICE and EV markets, while the electric used car market continued to mature with notable activity from high-profile brands such as Tesla, Volkswagen, and Hyundai.
Marketcheck UK data points to steady confidence in both markets, signalling that used vehicle stock levels and pricing structures remain healthy.
For more automotive market insights and access to comprehensive real-time and historical vehicle listings data, contact Marketcheck UK — your trusted source for deep market intelligence across the UK used car sector.
