Interpreting the shifts and nuances in the used car market is of central importance for automotive traders. By observing these movements, dealerships can refine their tactics and frame better expansion plans. This analysis will examine the data of the UK’s used car market, concentrating on combustion engine vehicles (ICE) and additionally assessing the accelerating influence of the electric used car market (EV).
The Continuing Growth of Electric in the Used Car Market
The used electric car market has been persistently developing, leading to a significant shift in buying trends. Let’s review the critical statistics that shaped the week ending on 1st November 2025.
For the week ending 1st November, the market documented a total of 36,587 used electric vehicles (EV) listed by 2,727 dealers.
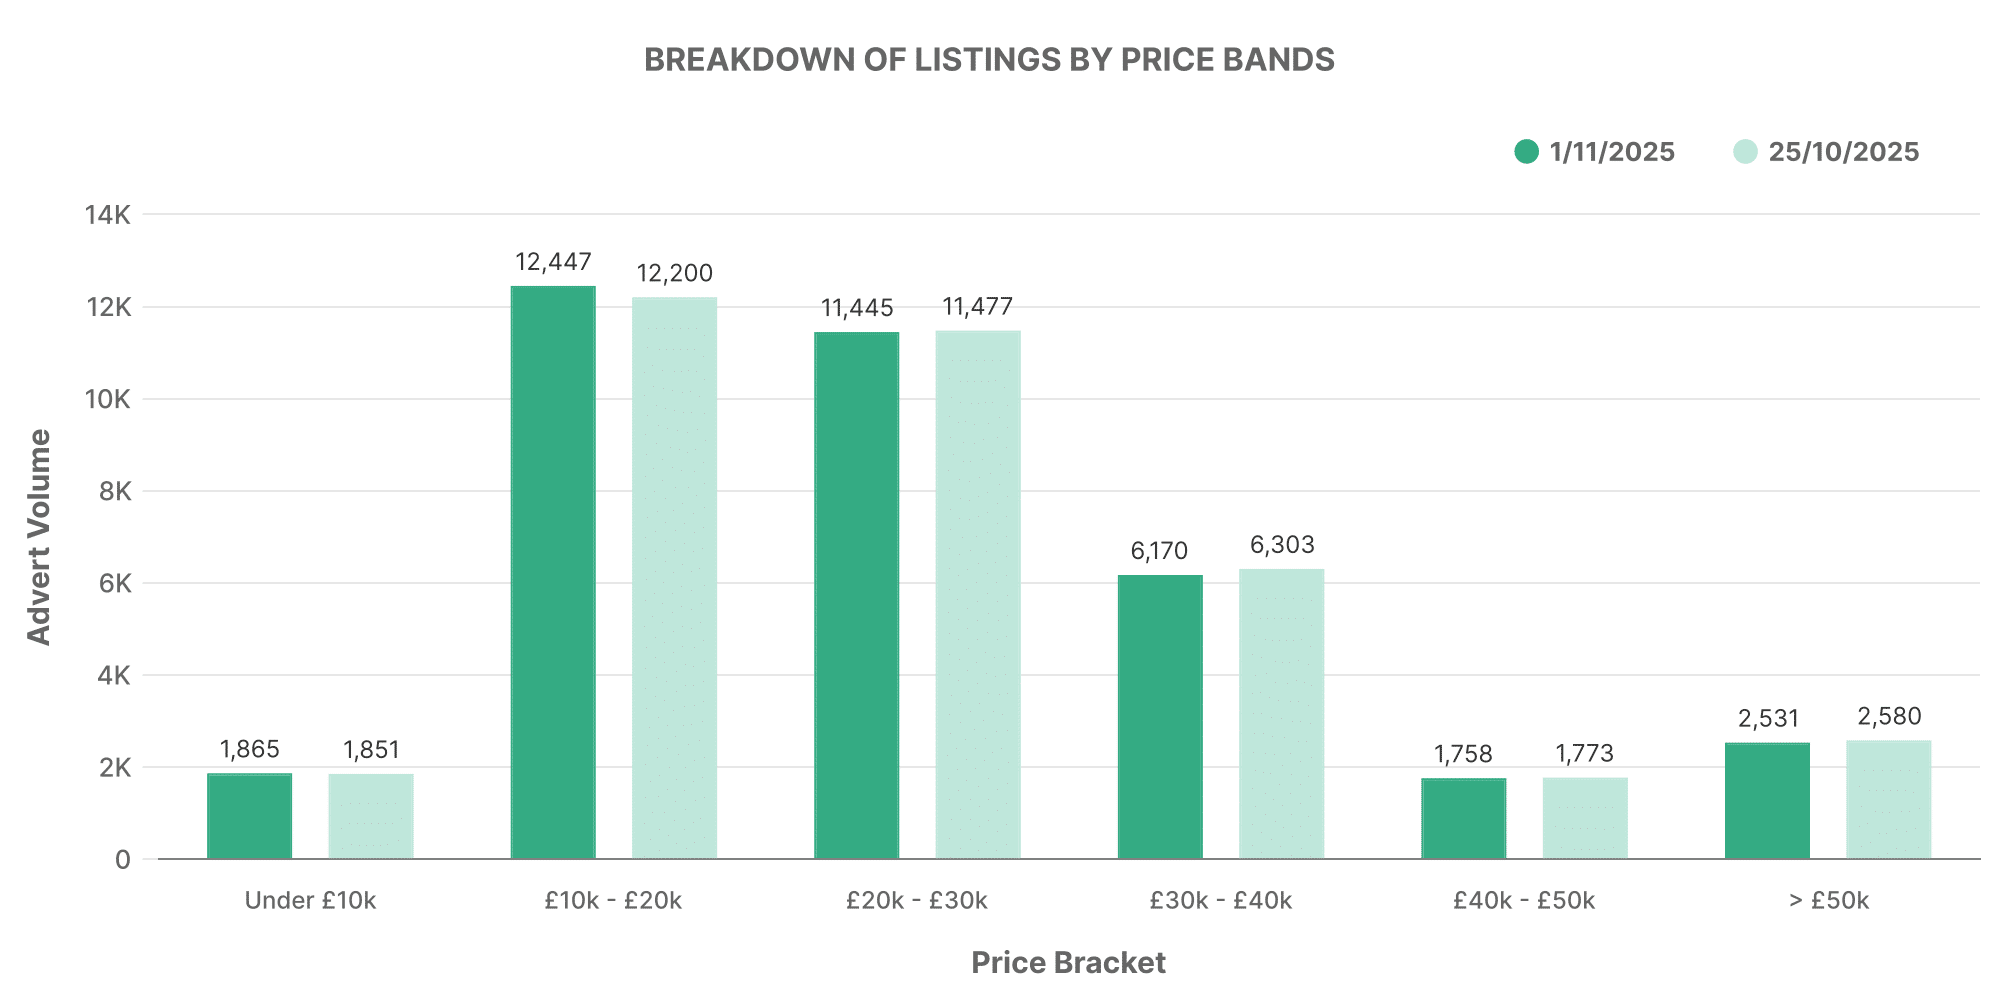
This graph displays a breakdown of these listings by price bands. The bulk of listed EVs were in the £10,000 – £20,000 bracket, accompanied by a substantial number in the £20,000 – £30,000 range. It is equally significant to note that there were also some luxury models priced above £50,000 contributing to the market.
The ever-growing range in EV pricing is indicative of an expanding market that is becoming more diverse, including vehicles of different models, makes, and functionalities to suit varied customer needs.
Comparison: ICE vs EV
On the contrary, conventional Internal-combustion engine vehicles (ICE) told a somewhat varied story. During the same period, a total of 617,590 used ICE vehicles were listed by 10,541 dealers.
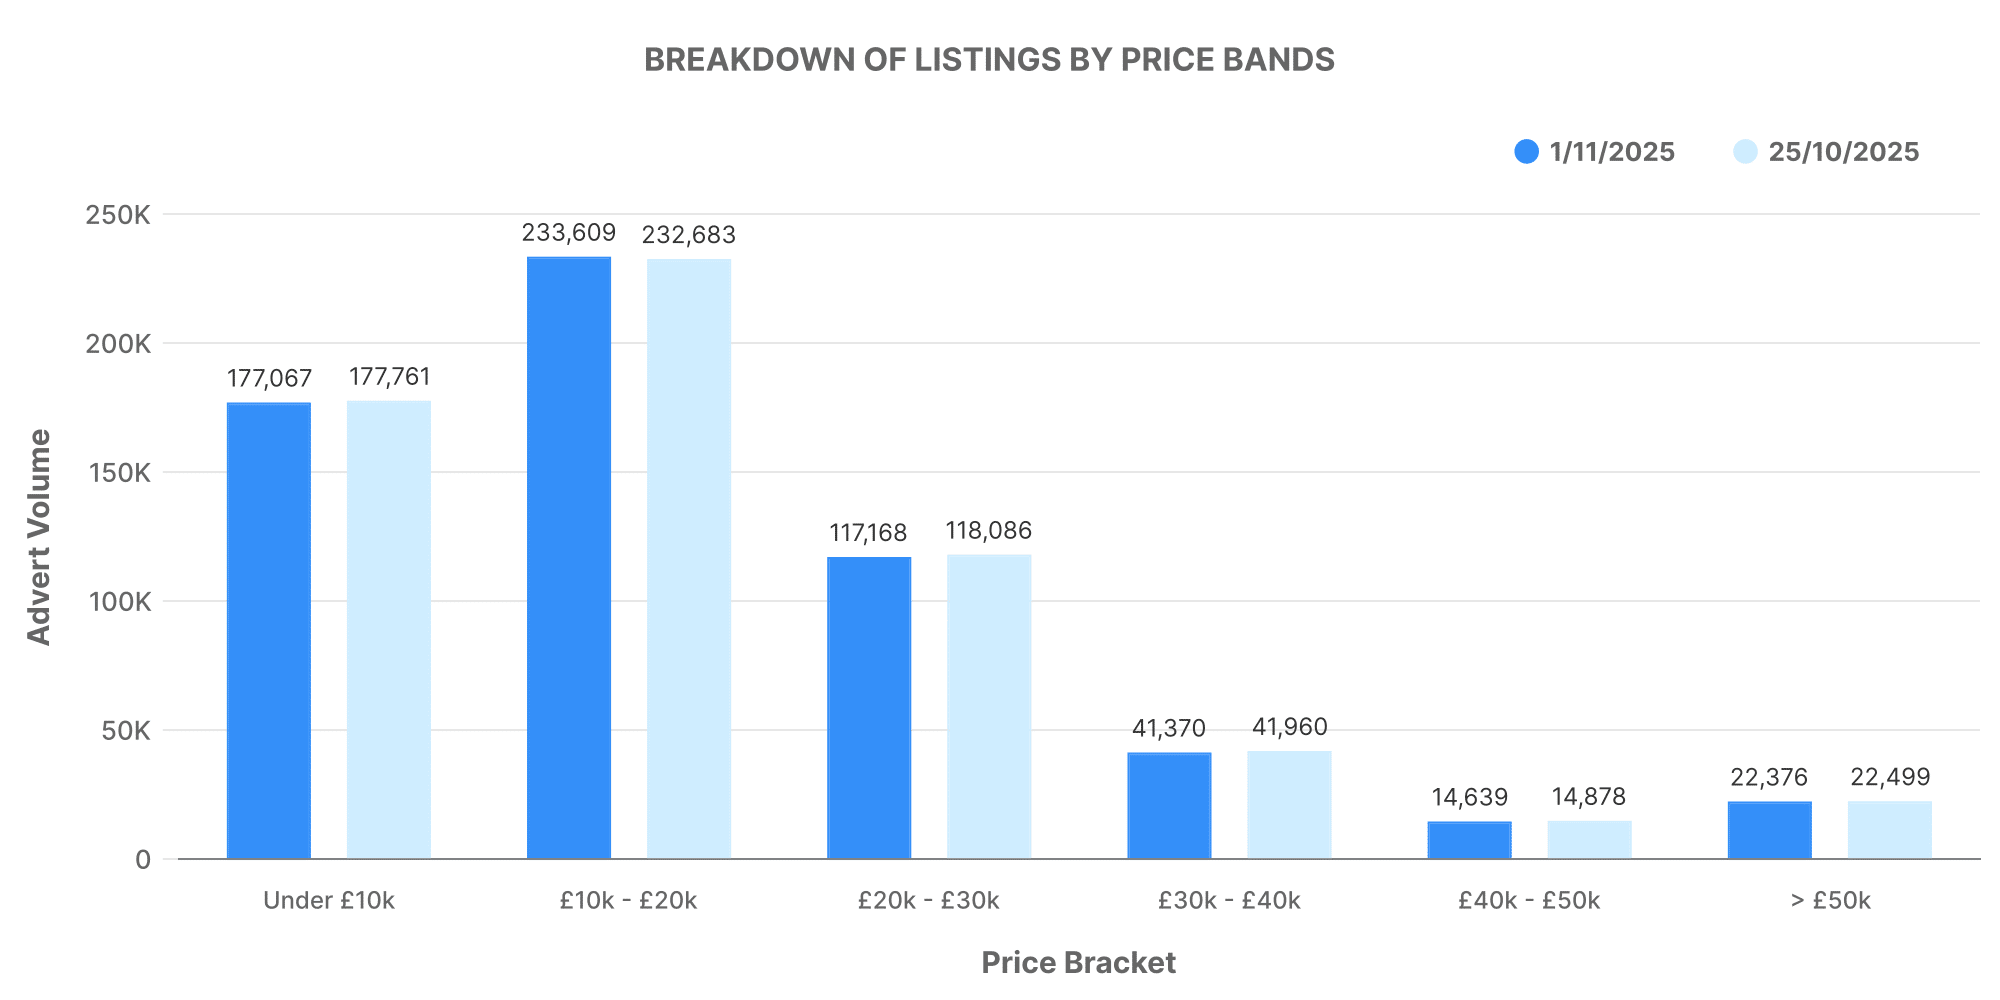
Analysing the ICE vehicle price bands, a similar pattern of price distribution is evident, with most cars within the £10,000 – £20,000 range. However, the average price of listed ICE vehicles, approximately £19,051, was visibly lower compared to EVs, which boasted an average of £26,468.
In-Depth Analysis of Dealer Volume
Analysing the distribution of dealership volumes provides more comprehensive insight.
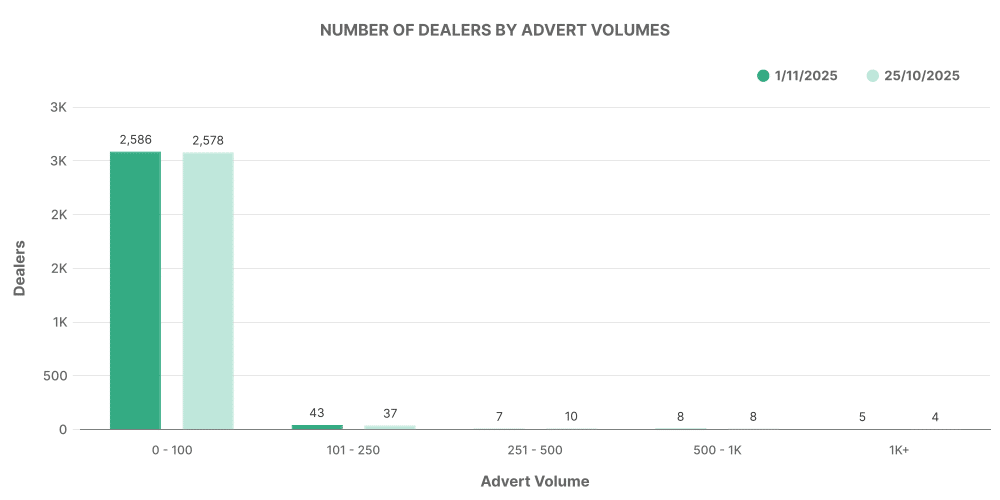
For EVs, the majority of dealers listed between 0-100 vehicles, demonstrating the relatively recent emergence of this market compared to ICE vehicles.
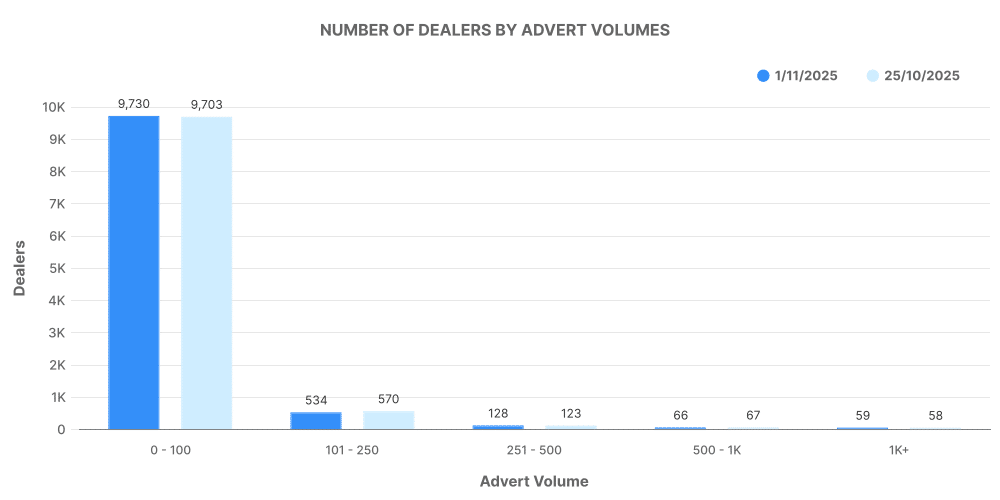
In stark contrast, ICE vehicle listing volumes were more evenly distributed, reflecting the well-established nature of this market where dealerships of various capacities participate.
Breakdown of Top 100 Dealers: ICE vs EV
Let’s assess an intriguing comparison: the analysis of the top 100 dealers by listing volume for both EVs and ICE vehicles.
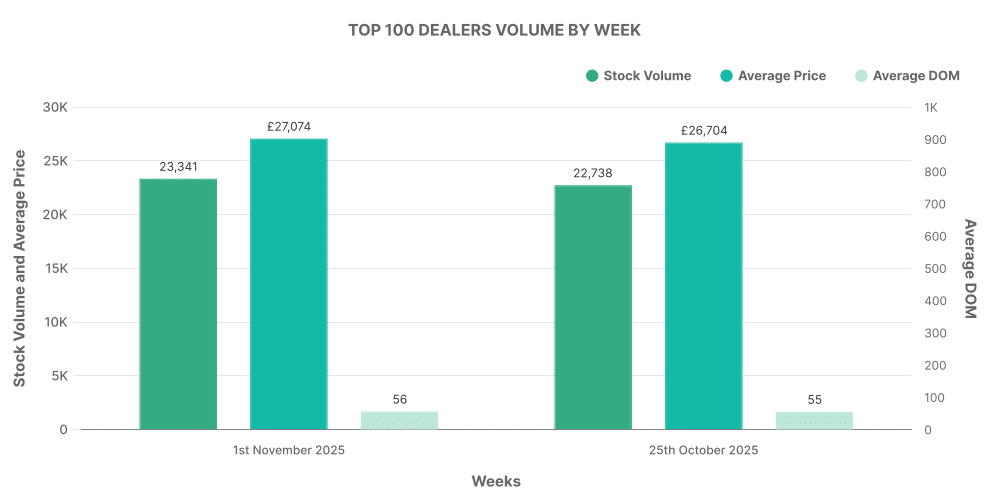
The top 100 dealers contributed 23,341 listings to the total EV market, equating to 6.38% of total EV offerings. These vehicles displayed an average price slightly higher than the overall market average.
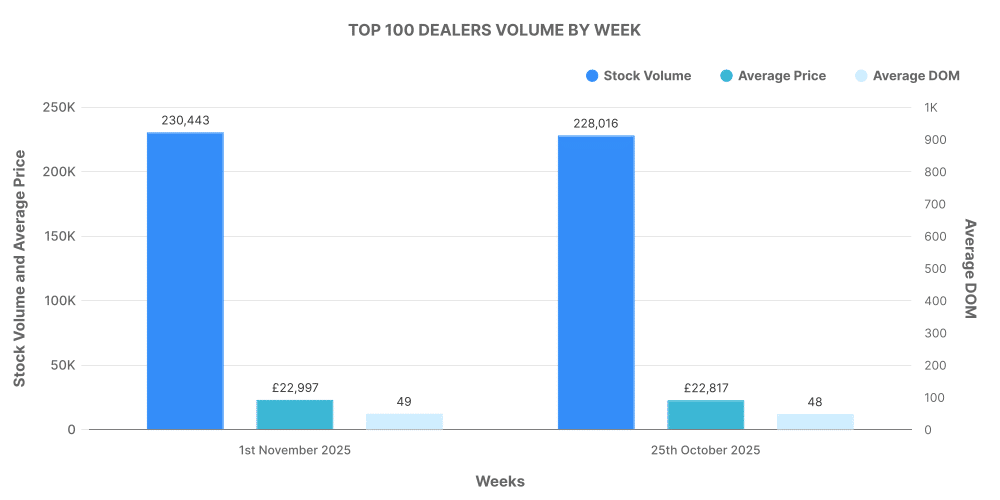
Conversely, the top 100 dealers in the ICE market contributed 230,443 to total listings, accounting for a substantial of 37.3% of total offerings.
Popular Electric Vehicle Models of the Week
The top 10 models in the electric car market were from Tesla, Polestar, Nissan, Volkswagen, Porsche, Hyundai, Audi, BMW, KIA, and Jaguar.
- Tesla Model 3 led the pack with 1,947 listings
- Tesla Model Y with 1,181 listings
- Polestar 2 with 924 listings
- Other popular models included the Nissan Leaf, Volkswagen ID.3, Porsche Taycan, Hyundai Kona, KIA Niro, BMW i4 and Jaguar I-Pace.
