The UK used car market has a lot to offer – from price trends to the growing share of electric vehicles (EV). This week’s data explains in detail the market conditions and performance for both internal combustion engine (ICE) cars and Electric vehicles (EV).
The Overview of Used Car Market (ICE)
For the week ending 8th November, the used car market data reveals 622,134 ICE car listings across 10,523 dealers – a slight increase from the previous week’s total listings of 617,590.
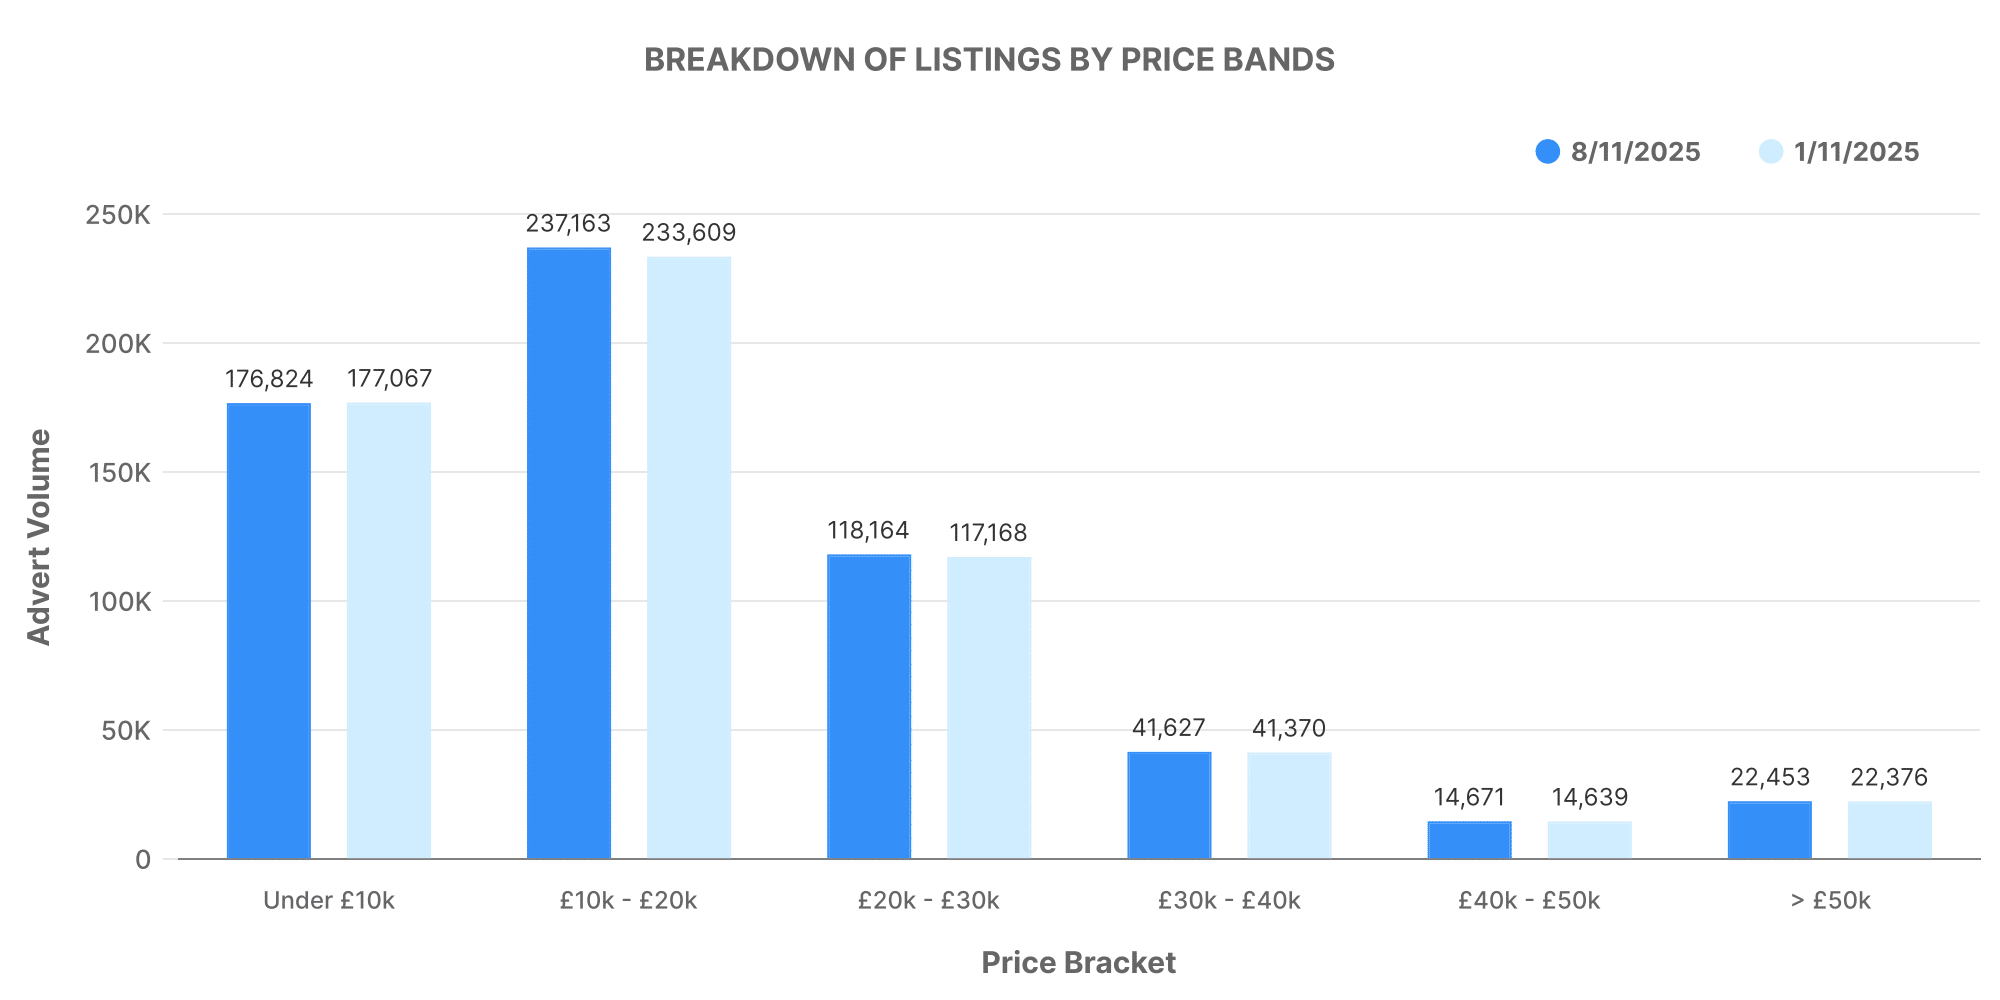
Reflecting on price distribution, a similar pattern was observed as the previous week. Most ICE vehicles fell within the price range of £10,000 to £20,000, with an average price of approximately £19,082 across all dealerships.
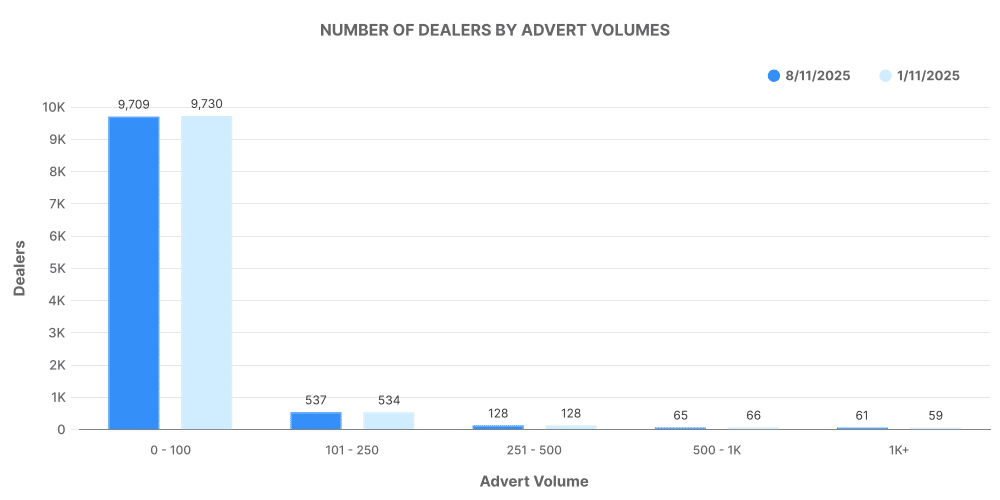
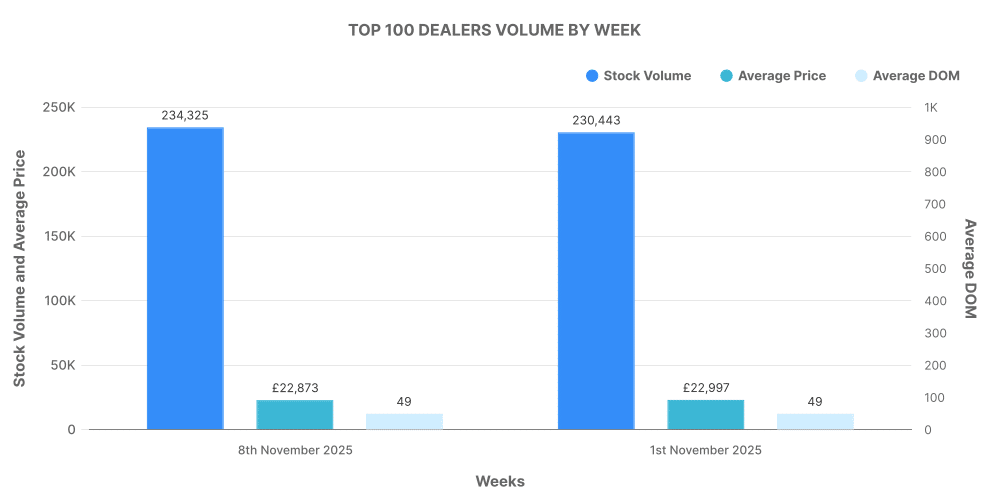
Interestingly, the number of dealerships with listings between 0-100 vehicles remained consistent. However, the inventory volume for the top 100 dealers by listing volume saw a noticeable increase, rising from 230,443 to 234,325.
Insights from the Electric Used Car Market (EV)
The electric market is proving its potential, with the total number of EVs listed for sale seeing a consistent growth. By the 8th of November, the number of used EV listings had increased from 36,587 to 37,177 across 2,728 dealerships.
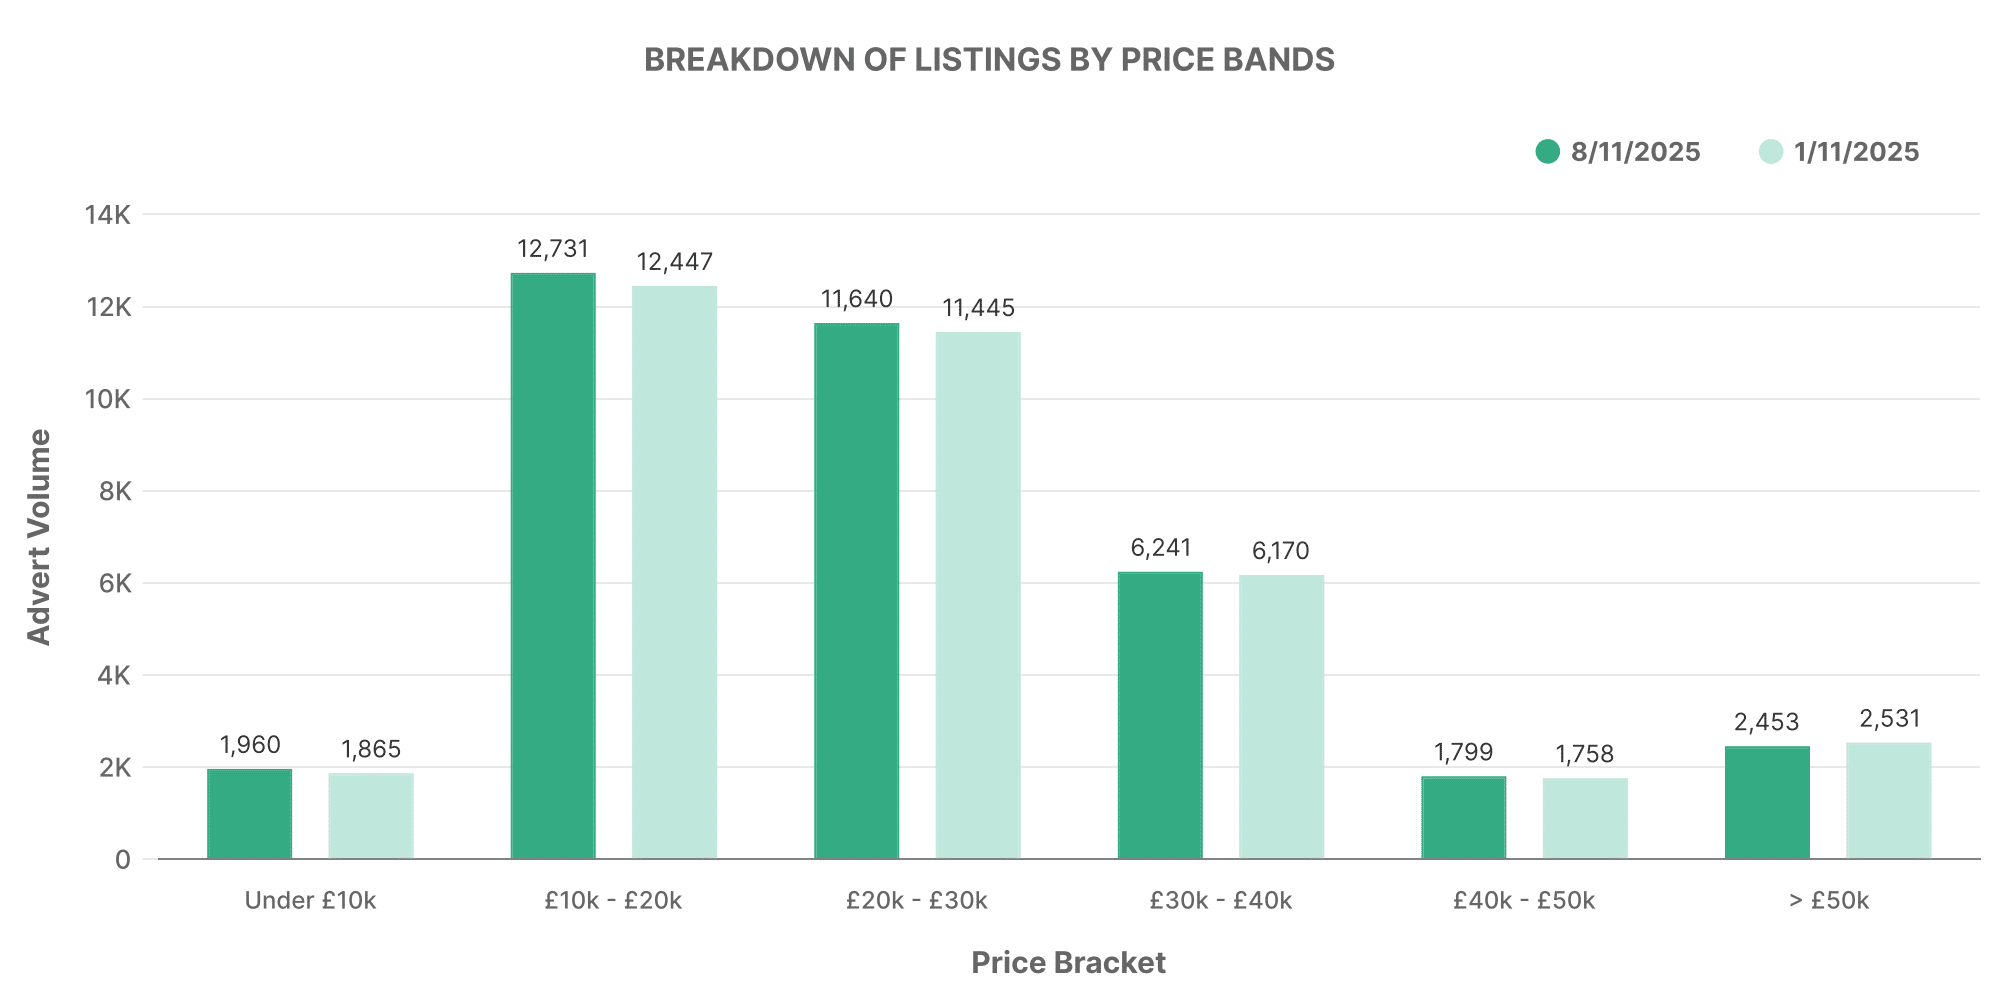
Just like the previous week, most EVs were priced between £10,000 and £20,000, however, the average price for these listings was noted to be significantly higher at around £26,312 compared to ICE vehicles.
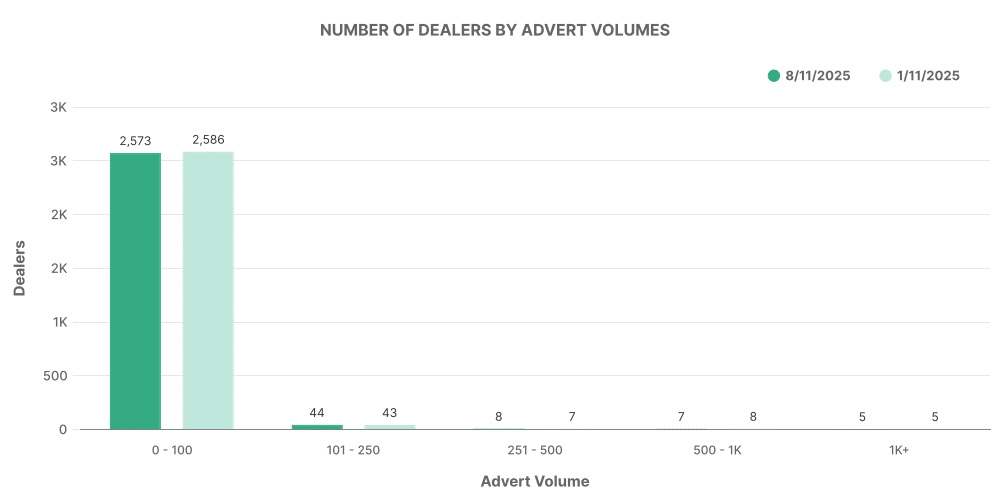
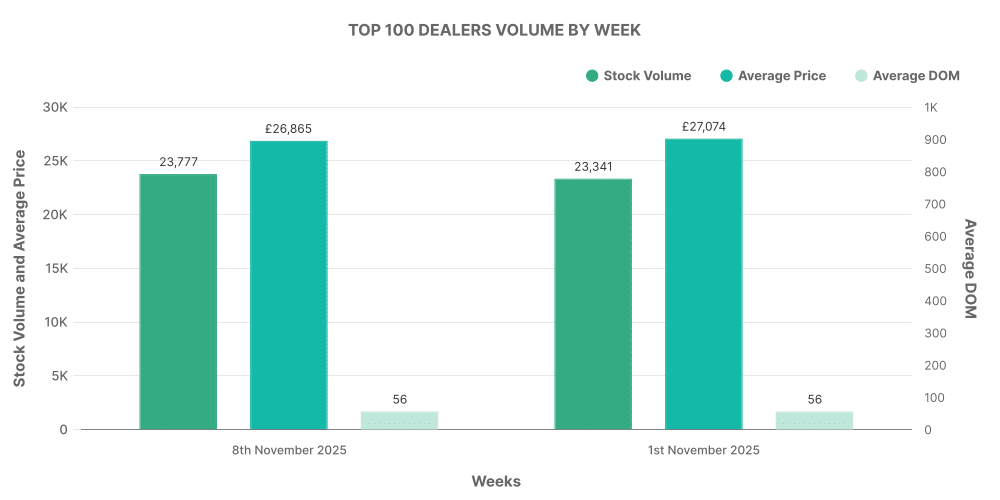
The number of dealerships listing between 0-100 EVs was also consistent, and the inventory volume noted for the top 100 dealers saw a marginal increase from 23,341 to 23,777.
Comparison: ICE vs EV
An insightful comparison can be made between ICE and EV vehicles by analysing the top 100 dealerships in terms of listing volume.
For ICE vehicles, the top 100 dealers had an increased stock volume from 230,443 to 234,325. In contrast, the respective figure for EVs saw a near identical increase from 23,341 to 23,777.
The transition towards electric vehicles is evident in the growing percentage of EVs in the total used car market. For the week of 8th November, EVs constituted 5.98% of the total used car market, a slight uptick from the previous week’s figure of 5.92%.
To conclude, the used car market data presents clear and informative insights into market trends in the UK, both for ICE and electric vehicles. These insights can help businesses involved in the UK automotive industry – car dealers, insurance companies, investment companies, car auction businesses, and car finance lenders and brokers — plan strategies and make data-driven decisions.
