As the year comes to a close, understanding the shifts within the UK used car market is critical for dealers, car finance providers, and other automotive sector stakeholders. This week’s data provides an insightful snapshot of the market, focusing on both Internal Combustion Engine (ICE) vehicles and Electric Vehicles (EVs). With the increasing prominence of EVs, it is important for automotive businesses to analyse these trends to stay competitive and make informed decisions. Let’s break down the key findings.
Used Car Market Insights (ICE)
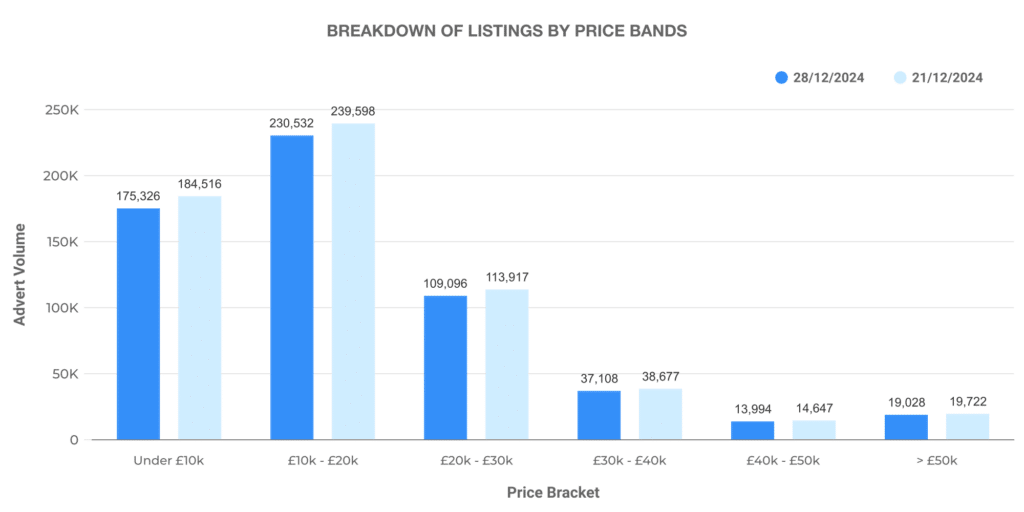
The UK used car market remains robust, with dealers listing a total of 595,678 used ICE cars this week, a slight decrease compared to the previous week’s figure of 621,158. This volume is spread across multiple price bands, with the most significant share falling in the £10,000 to £20,000 range, which represents 185,510 listings, closely followed by the £20,000 to £30,000 band at 230,532 listings.
Dealer Volume Analysis:
- Total Dealers: 10,471
- Top 100 Dealers: Representing 221,287 listings, or 37.2% of the total market. These dealers had a higher average price of £22,107 compared to the rest of the market, which averaged £21,519.
- Dealer Volume Distribution:
- 0-100 Vehicles: 87% of dealers listed fewer than 100 vehicles.
- 101-250 Vehicles: 7% of dealers had between 101 and 250 vehicles.
- 251-500 Vehicles: 4% of dealers fell into this category.
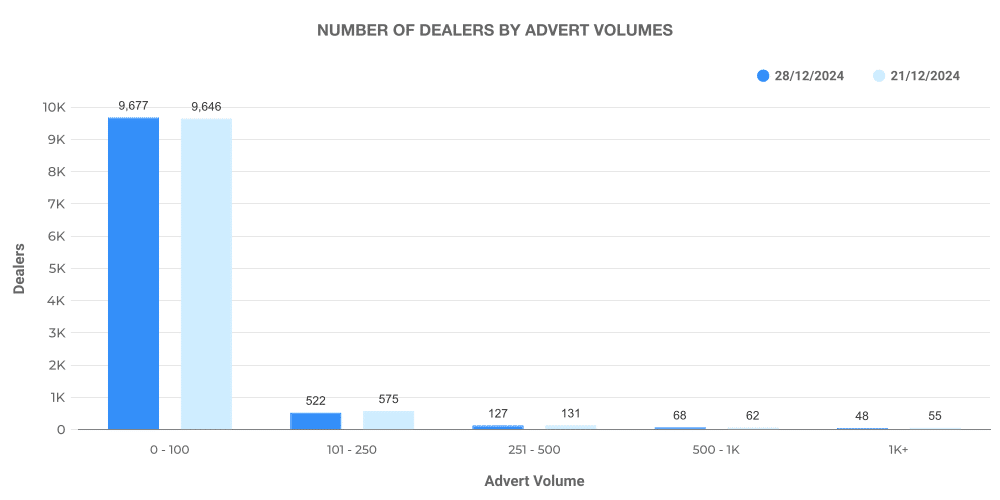
The data shows that while the number of cars listed has decreased slightly, the pricing remains stable, with the market continuing to favour the mid-range price bands. This indicates a steady demand across multiple segments and a consistent flow of new listings from dealers.
Electric Used Car Market (EV)
The electric vehicle market continues to grow, although it represents a smaller proportion of the total used car market. This week, there were 82,723 listings for used electric cars, compared to 84942 listings the previous week. Despite the slight drop in listings, the market for EVs remains a key area of interest.
Key Insights:
- Percentage Share of EVs: 13.89% of the total used car listings were electric, slightly up from 13.67% last week.
- Price Bands for EVs:
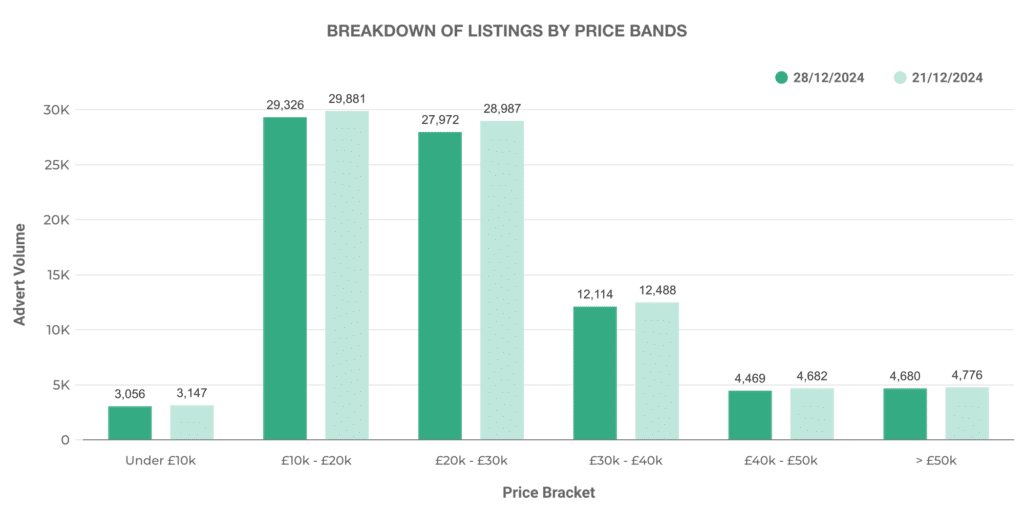
- The largest portion of EV listings fell in the £10,000 to £20,000 range, with 30,326 listings, followed by the £20,000 to £30,000 band with 29,972 listings.
- The most premium EVs listed were priced above £50,000, with 12,114 listings, a reflection of the increasing availability of higher-end electric models.
Dealer Volume Analysis:
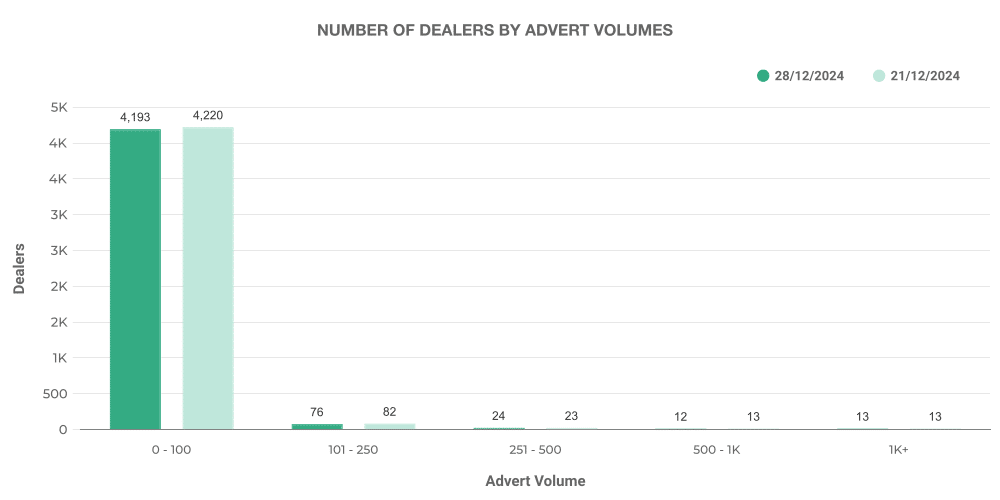
- Total Dealers: 4,395
- Top 100 Dealers: Account for 50,453 listings, representing 60.9% of the total EV market, with an average price of £26,688, higher than the overall EV market average of £26,707.
- Dealer Volume Distribution:
- 0-100 Vehicles: 95% of EV dealers listed fewer than 100 vehicles, reinforcing the still-developing nature of the electric car market compared to ICE vehicles.
Breakdown of Listings by Price Bands
ICE Vehicles:
- The most significant volume of used ICE vehicles continues to be concentrated in the mid-range price brackets. The £10,000 to £20,000 price band remains the dominant segment, with 185,510 listings. This is followed by the £20,000 to £30,000 band, which shows a slight increase in demand as consumers seek more affordable mid-range vehicles. The average price of ICE vehicles listed this week was £18,465.
EV Vehicles:
- The EV market shows a similar trend in price band distribution. The £10,000 to £20,000 range dominates the market for used electric cars, with 30,326 listings, while the £20,000 to £30,000 band follows closely with 29,972 listings. Interestingly, there is a noticeable presence of higher-end EVs above £50,000, which are becoming more common as the market matures. The average price of listed EVs this week was £26,688.
Analysis of Top 100 Dealers by Volume
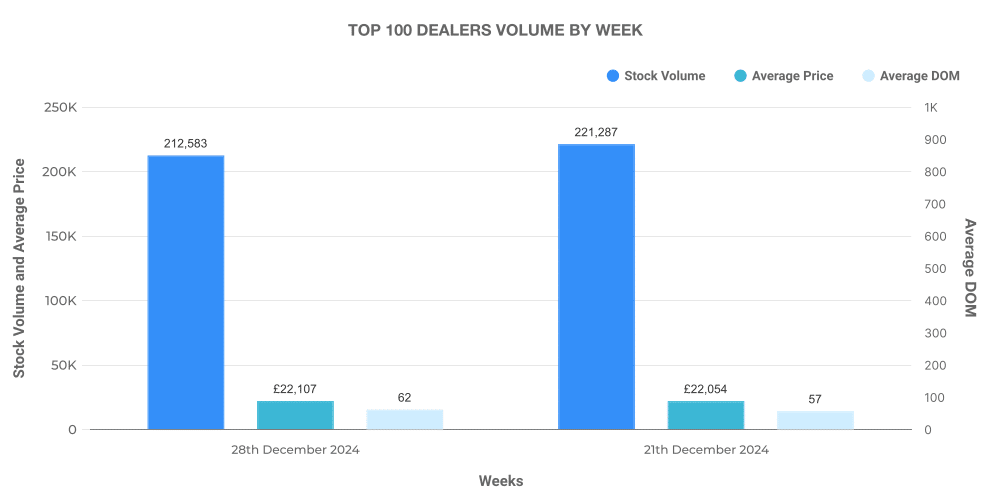
ICE Vehicles: The top 100 dealers accounted for 37.2% of the total listings for ICE vehicles, with a significant share of these dealers focusing on mid-range price bands. The average price for cars listed by the top dealers was £22,107, higher than the overall market average of £21,519. This suggests that top dealers continue to offer higher-value vehicles, targeting more affluent buyers.
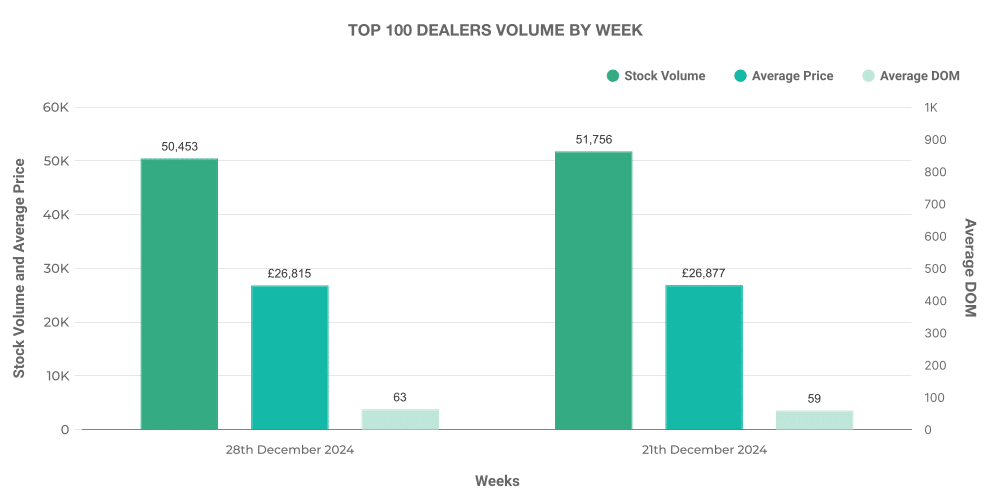
EV Vehicles: Similarly, the top 100 dealers in the EV sector listed 60.9% of the total EV vehicles, with an average listing price of £26,688, which is higher than the overall EV market average. This points to the fact that top dealers are leading the charge with premium EV models, catering to the growing demand for higher-end electric cars.
Percentage Comparison: EV vs ICE
When comparing the proportion of EV listings to ICE listings, the trend towards electric vehicles is clear, though the overall percentage of EVs remains relatively small at 13.89%. This suggests that while the electric used car market is growing, it still accounts for a smaller share of the total used car listings. ICE vehicles, on the other hand, make up the vast majority of the market, at 86.11%.
This split highlights the evolving nature of the automotive industry. As the market continues to transition towards electric mobility, the percentage of EV listings is expected to rise steadily over the coming months. Dealers looking to stay ahead of the curve will need to invest in electric vehicles to meet growing consumer demand.
Monthly report: December 2024 | Previous week: 21st December
