Understanding the used car market helps automotive businesses refine their strategies and stay ahead. This week’s analysis looks at the latest UK car price trends, comparing internal combustion engine (ICE) vehicles and electric used cars (EVs). The data reveals key shifts in dealer listings, pricing, and stock distribution.
Used Car Market Overview (ICE)
For the week ending 7th December 2024, a total of 611,830 used ICE vehicles were listed by 10,504 dealers across 14,421 rooftops. The average days on market remained stable at 87 days, while the average listing price stood at £18,328.
Breakdown of Listings by Price Bands
- £0 – £10,000: 184,901 listings
- £10,000 – £20,000: 235,083 listings
- £20,000 – £30,000: 110,852 listings
- £30,000 – £40,000: 37,825 listings
- £40,000 – £50,000: 14,146 listings
- £50,000+: 18,953 listings
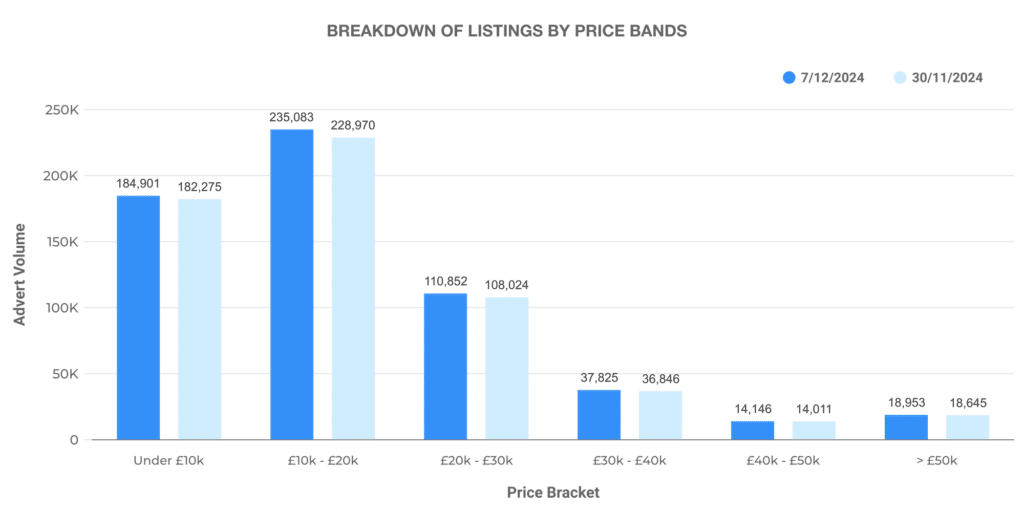
The largest segment remains the £10,000 – £20,000 price range, accounting for around 38.4% of all ICE vehicle listings. Premium-priced vehicles above £50,000 represent a smaller portion at just 3.1%.
Dealer Advert Volumes
Stock distribution across dealers remains consistent, with the majority listing 0-100 vehicles:
- 0-100 vehicles: 9,658 dealers
- 101-250 vehicles: 569 dealers
- 251-500 vehicles: 121 dealers
- 500-1,000 vehicles: 69 dealers
- 1,000+ vehicles: 52 dealers
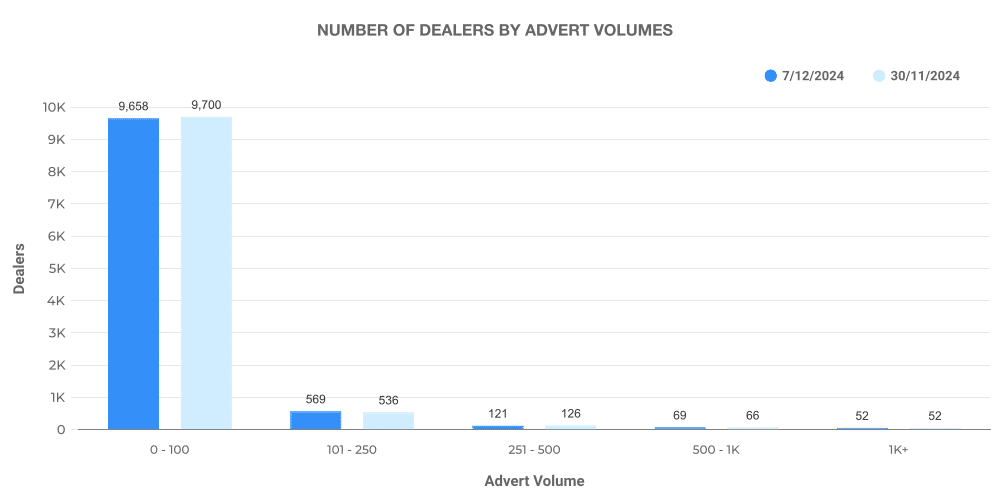
This reflects the dominance of smaller independent dealerships, with only a limited number of high-volume dealers handling over 1,000 ICE car listings.
Top 100 Dealers by Volume
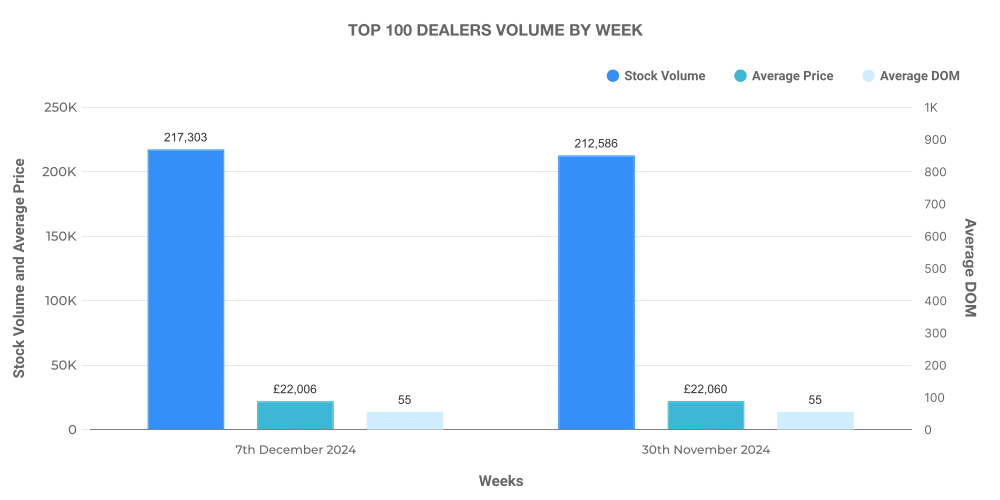
The top 100 dealers accounted for 217,303 listings, maintaining an average stock age of 55 days. The average price within this group stood at £22,006, higher than the overall ICE market average. Outside of these top dealers, 394,527 vehicles were listed with a similar average age of 104 days and a lower price of £16,287.
Electric Used Car Market Overview (EV)
For the same period, 80,059 used EVs were listed by 4,404 dealers across 7,668 rooftops. The average days on market for EVs was 66 days, reflecting faster turnover compared to ICE vehicles. The average EV price stood at £26,659, significantly higher than ICE vehicles.
Breakdown of EV Listings by Price Bands
- £0 – £10,000: 3,053 listings
- £10,000 – £20,000: 27,816 listings
- £20,000 – £30,000: 27,471 listings
- £30,000 – £40,000: 11,943 listings
- £40,000 – £50,000: 4,371 listings
- £50,000+: 4,347 listings
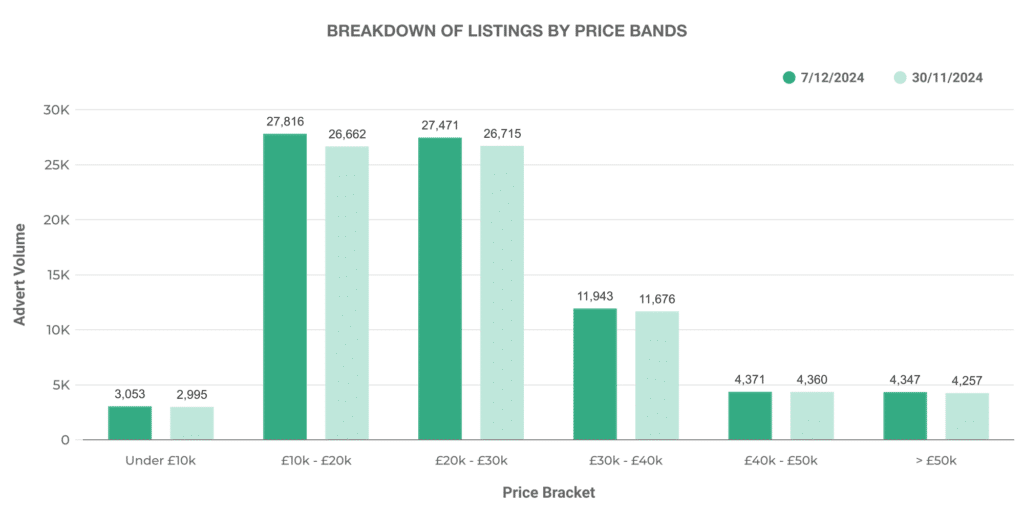
Most EVs fall into the £10,000 – £20,000 and £20,000 – £30,000 brackets, similar to the ICE market, though higher-priced EVs make up a larger share of total listings.
Dealer Advert Volumes
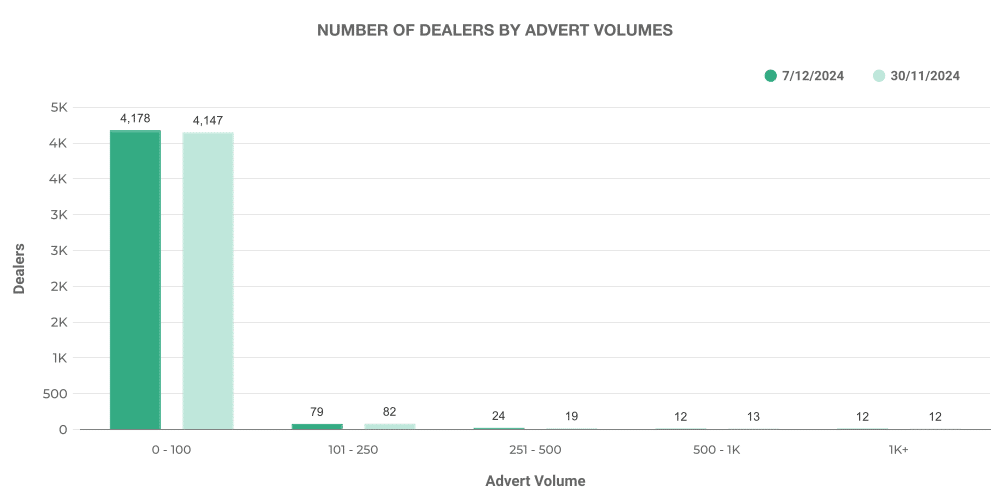
EV dealer distribution remains similar to ICE, with most stocking 0-100 vehicles:
- 0-100 vehicles: 4,347 dealers
- 101-250 vehicles: 417 dealers
- 251-500 vehicles: 79 dealers
- 500-1,000 vehicles: 24 dealers
- 1,000+ vehicles: 12 dealers
Top 100 EV Dealers by Volume
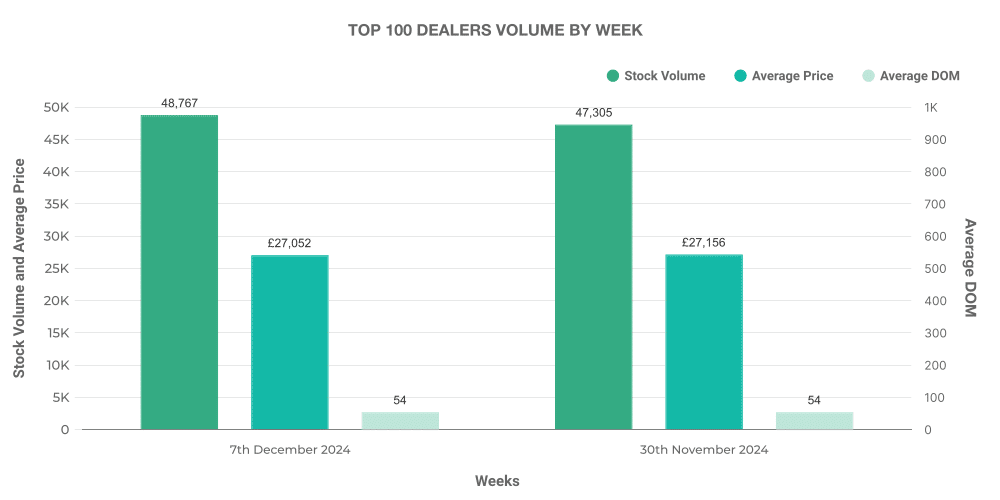
The top 100 EV dealers held 48,767 listings, with an average stock age of 54 days. Their average price was £27,052, higher than the overall EV market average. Outside this group, 31,292 listings had a longer market duration of 84 days and a lower price of £26,039.
EV vs ICE Market Share and Pricing
- EV share of total used market: 13.09%
- ICE share of total used market: 86.91%
- Average price of EVs: £26,659
- Average price of ICE vehicles: £17,069
Electric vehicles continue to hold a small but growing share of the used car market. While ICE vehicles still dominate listings, the higher average price and faster turnover of EVs indicate sustained demand.
Most Advertised Used Car Models (All Fuel Types)
The top advertised models last week were:
- Toyota Yaris – 4,069 listings
- Toyota C-HR – 2,980 listings
- KIA Niro – 2,849 listings
- Toyota Corolla – 2,592 listings
- BMW 3 Series – 1,983 listings
- Ford Kuga – 1,807 listings
- Hyundai Kona – 1,739 listings
- Toyota RAV4 – 1,707 listings
- Tesla Model 3 – 1,704 listings
- Hyundai Tucson – 1,566 listings
These insights help businesses track demand shifts in the used car market. Dealers and investors looking to capitalise on these trends can leverage Marketcheck UK’s data tools for informed decision-making.
Next week: 14th December | Previous month: November 2024
