The used car market across the UK remained highly active throughout April 2025. Across both internal combustion engine (ICE) vehicles and electric vehicles (EV), listing volumes, dealer participation, and pricing trends continue to offer clear signals for those in the automotive trade.
This report provides a breakdown of April’s car inventory data across key metrics: price bands, dealer stock volumes, and the ongoing shift in EV market share. Whether you’re a car dealer, auction house, investor, or finance provider, these insights are designed to help frame decisions and planning.
Internal Combustion Engine (ICE) Market Overview
General Market Metrics
In April 2025, 10,896 dealers listed used ICE cars across 15,306 rooftops. The total volume of ICE listings reached 811,115 vehicles, with an average price of £18,508. The average number of days vehicles stayed on market was 76 days, which is broadly consistent with the previous month.
Breakdown of Listings by Price Bands
The ICE used car market remains heavily concentrated in the mid-tier price bands:
- £0–£10,000: 239,494 listings
- £10,001–£20,000: 314,596 listings
- £20,001–£30,000: 143,227 listings
- £30,001–£40,000: 48,836 listings
- £40,001–£50,000: 19,503 listings
- £50,000+: 27,259 listings
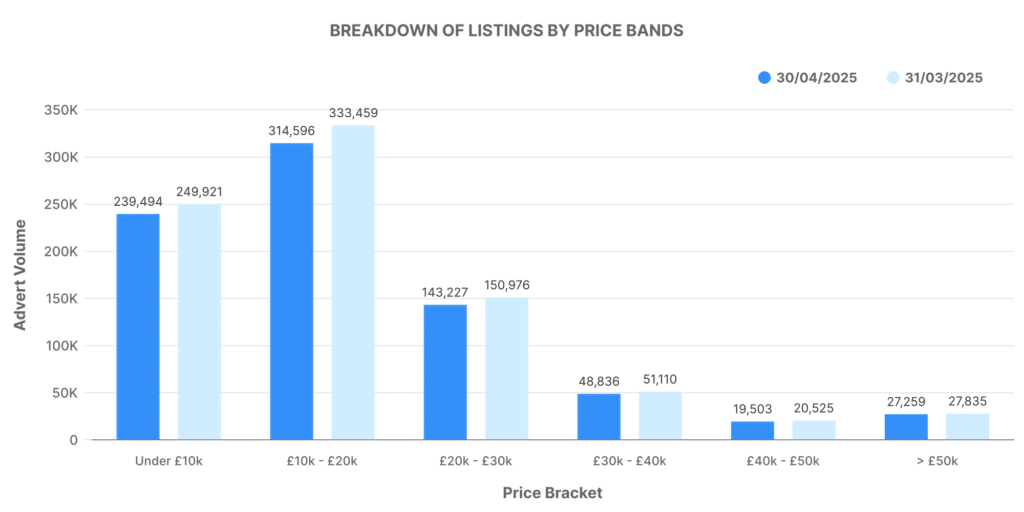
The £10,000–£20,000 band continues to dominate ICE listings, followed by the sub-£10,000 range. Together, these categories account for over two-thirds of all listings, reinforcing their significance for value-focused dealers and buyers.
Number of Dealers by Advert Volumes
Inventory distribution shows the bulk of ICE dealers holding stock volumes of:
- 0–100 vehicles: 9,649 rooftops
- 101–250 vehicles: 882 rooftops
- 251–500 vehicles: 158 rooftops
- 501–1,000 vehicles: 74 rooftops
- 1,000+ vehicles: 87 rooftops
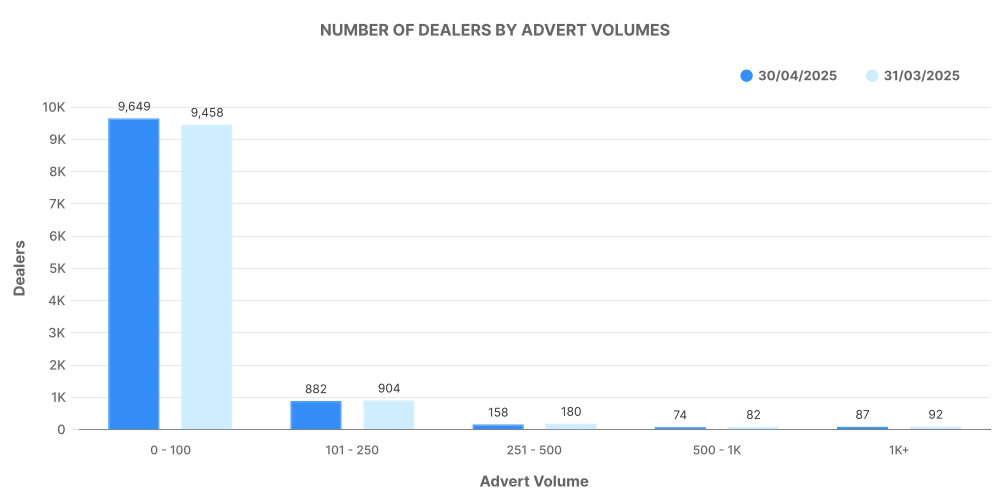
This skew towards smaller dealer inventories reflects the long tail of independent forecourts and regional retailers, though large franchises remain a core influence in top-tier stock volumes.
Analysis of Top 100 Dealers by Volume
The top 100 ICE dealers held 300,846 listings (approx. 37.1% of all ICE listings). Their average time on market was 48 days, suggesting better turnover and stronger stock management than the broader average of 76 days.
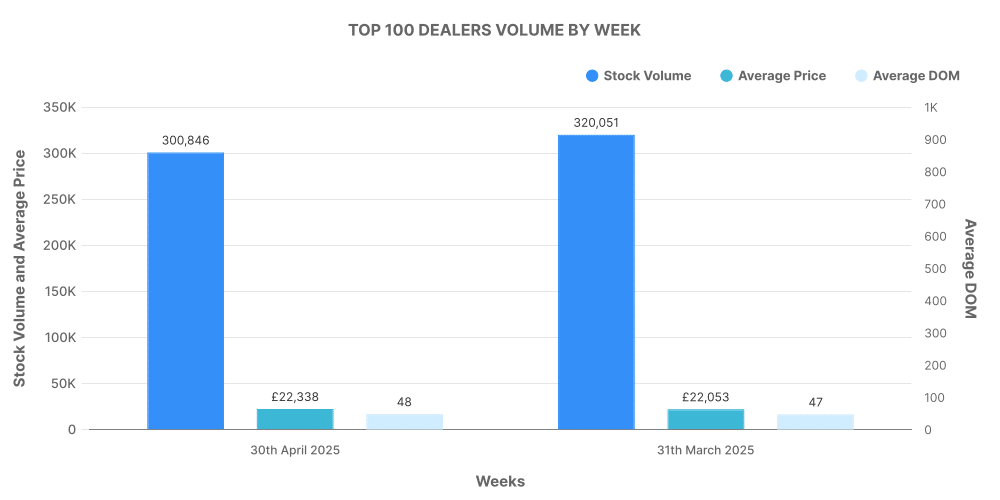
These top dealers listed vehicles at an average price of £22,338, which is around £3,800 higher than the rest of the market. Among these, 97,529 listings saw price increases during the month, compared to 151,545 price decreases — highlighting a more cautious or reactive approach to pricing amidst broader market conditions.
Electric Used Car Market (EV) Overview
General Market Metrics
The electric used car market retained stable momentum in April, with 125,992 EVs listed by 5,106 dealers operating across 8,889 rooftops. The average price for a used EV was £26,028, and the average time on market rose slightly to 62 days.
Breakdown of Listings by Price Bands
EV listings are still primarily concentrated in affordable to mid-range bands:
- £0–£10,000: 5,349 listings
- £10,001–£20,000: 47,136 listings
- £20,001–£30,000: 41,484 listings
- £30,001–£40,000: 17,006 listings
- £40,001–£50,000: 6,426 listings
- £50,000+: 6,809 listings
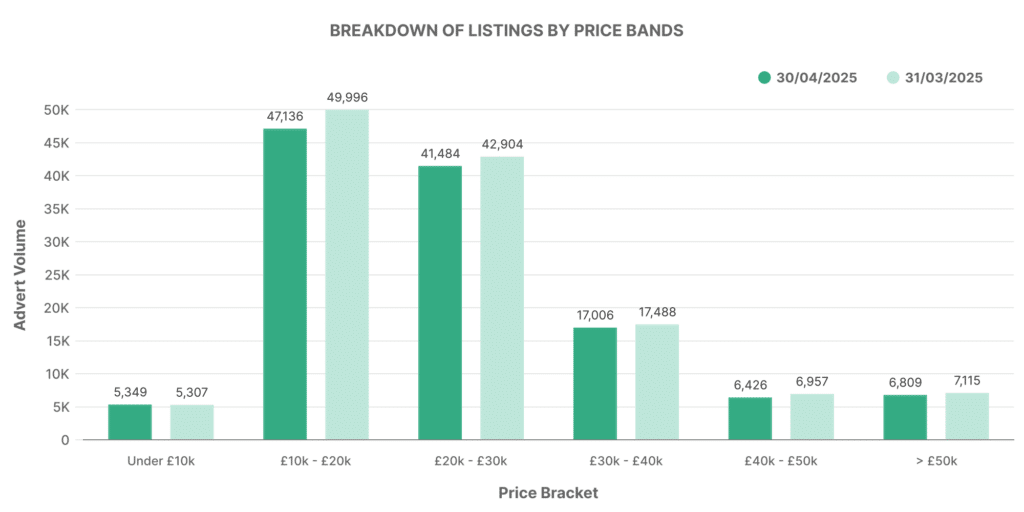
There’s a visible alignment between EV and ICE listings in terms of price concentration, although EVs have a noticeably higher share in the £20,000–£30,000 band.
Number of Dealers by Advert Volumes
Most EV dealers manage smaller inventories, echoing the earlier stages of market development:
- 0–100 vehicles: 4,822 rooftops
- 101–250 vehicles: 85 rooftops
- 251–500 vehicles: 41 rooftops
- 501–1,000 vehicles: 24 rooftops
- 1,000+ vehicles: 20 rooftops
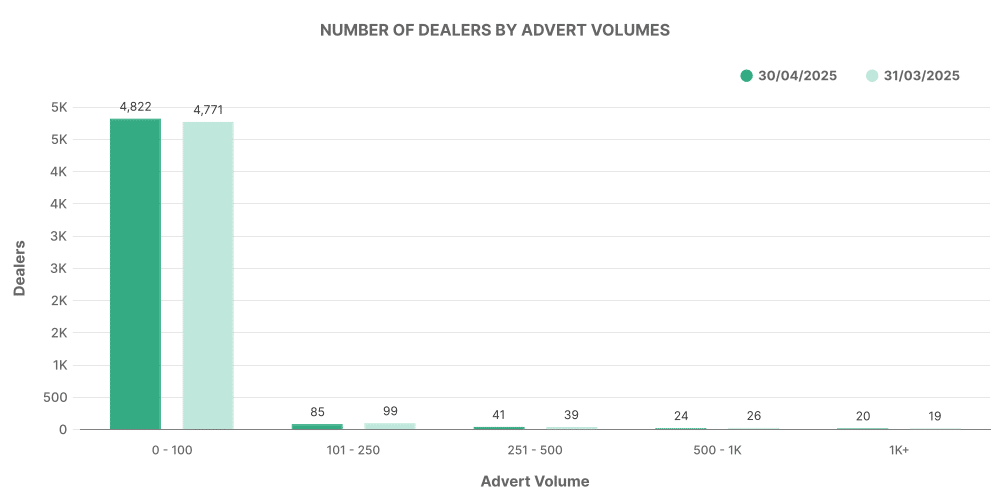
The share of dealers with higher EV stock volumes is gradually increasing, indicating steady institutional commitment from larger retailers and leasing businesses.
Analysis of Top 100 EV Dealers by Volume
The top 100 EV dealers listed 78,175 vehicles, accounting for 62.1% of all EV listings. Their average time on market was 51 days, substantially faster than the wider EV average.
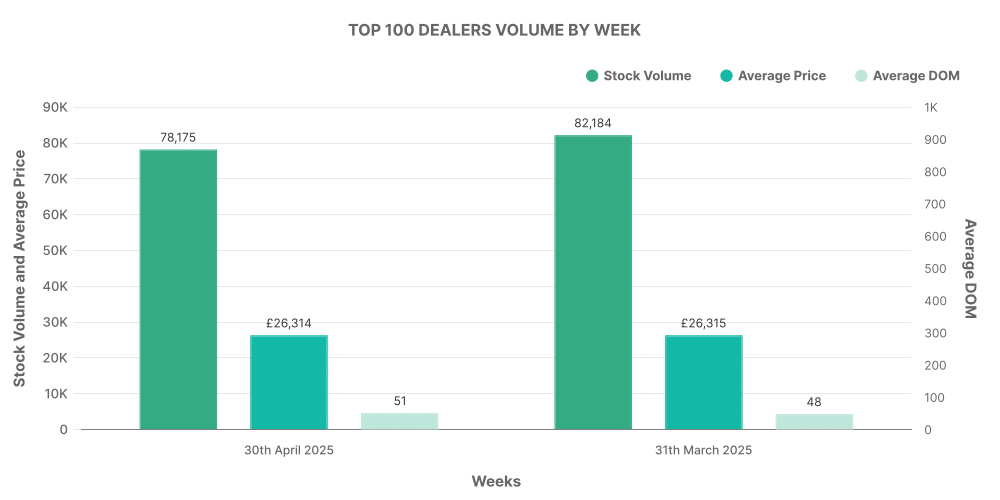
Vehicles sold by this group were priced at an average of £26,314, slightly above the overall EV market average. Of these listings, 25,930 increased in price, and 24,582 dropped in price, showing a more balanced pricing strategy compared to ICE listings.
Comparing EVs to ICE Vehicles
Market Share
In April 2025, electric vehicles made up 15.53% of the total used car market, holding steady from March. This translates to more than one in seven used vehicles listed now being electric. The remaining 84.47% of listings were ICE vehicles.
Average Price Comparison
- Average price of EVs: £26,028
- Average price of ICE vehicles: £17,110
The gap between average EV and ICE pricing continues to narrow, but EVs still command a premium of nearly £9,000. For lenders and insurers, this pricing difference highlights potential variations in risk assessment and residual value modelling.
Average Time on Market
- EV average days on market: 62 days
- ICE average days on market: 76 days
EVs are typically moving faster once listed, which may reflect greater demand or better-targeted inventory from the dealers who specialise in electrified stock.
Top EV Models Listed in April 2025
EV listings remain anchored by a handful of high-frequency models. These make/models dominated electric inventory throughout April:
- Toyota Yaris – 6,558 listings
- KIA Niro – 4,490 listings
- Toyota C-HR – 4,180 listings
- Toyota Corolla – 3,655 listings
- Tesla Model 3 – 3,444 listings
- Honda Jazz – 2,810 listings
- Hyundai Tucson – 2,576 listings
- BMW 3 Series – 2,403 listings
- Ford Kuga – 2,369 listings
- KIA Sportage – 2,329 listings
These volumes suggest strong fleet offloads or end-of-lease returns from recent model years. Toyota dominates this list with three entries in the top five – a trend that may inform sourcing strategies for remarketers and bulk buyers.
