UK Monthly Used Car Market Data – September 2024
Understanding the shifts and patterns in the used car market is a prime concern for all automotive dealers. Observing these trends can help dealers amplify their strategies and better plan for growth. This analysis will delve into the data around the used car market in the UK, focusing not only on combustion engine vehicles (ICE) but also taking a closer look at the increasingly significant electric used car market (EV).
The Rise of Electric in the Used Car Market
The electric used car market has been growing steadily for some time now, marking a notable shift in buying patterns. As August 2024 comes to an end, let’s observe the key statistics that defined this month.
For August, the market saw a total of 326,576 used electric vehicles (EV) listed by 4836 dealers.
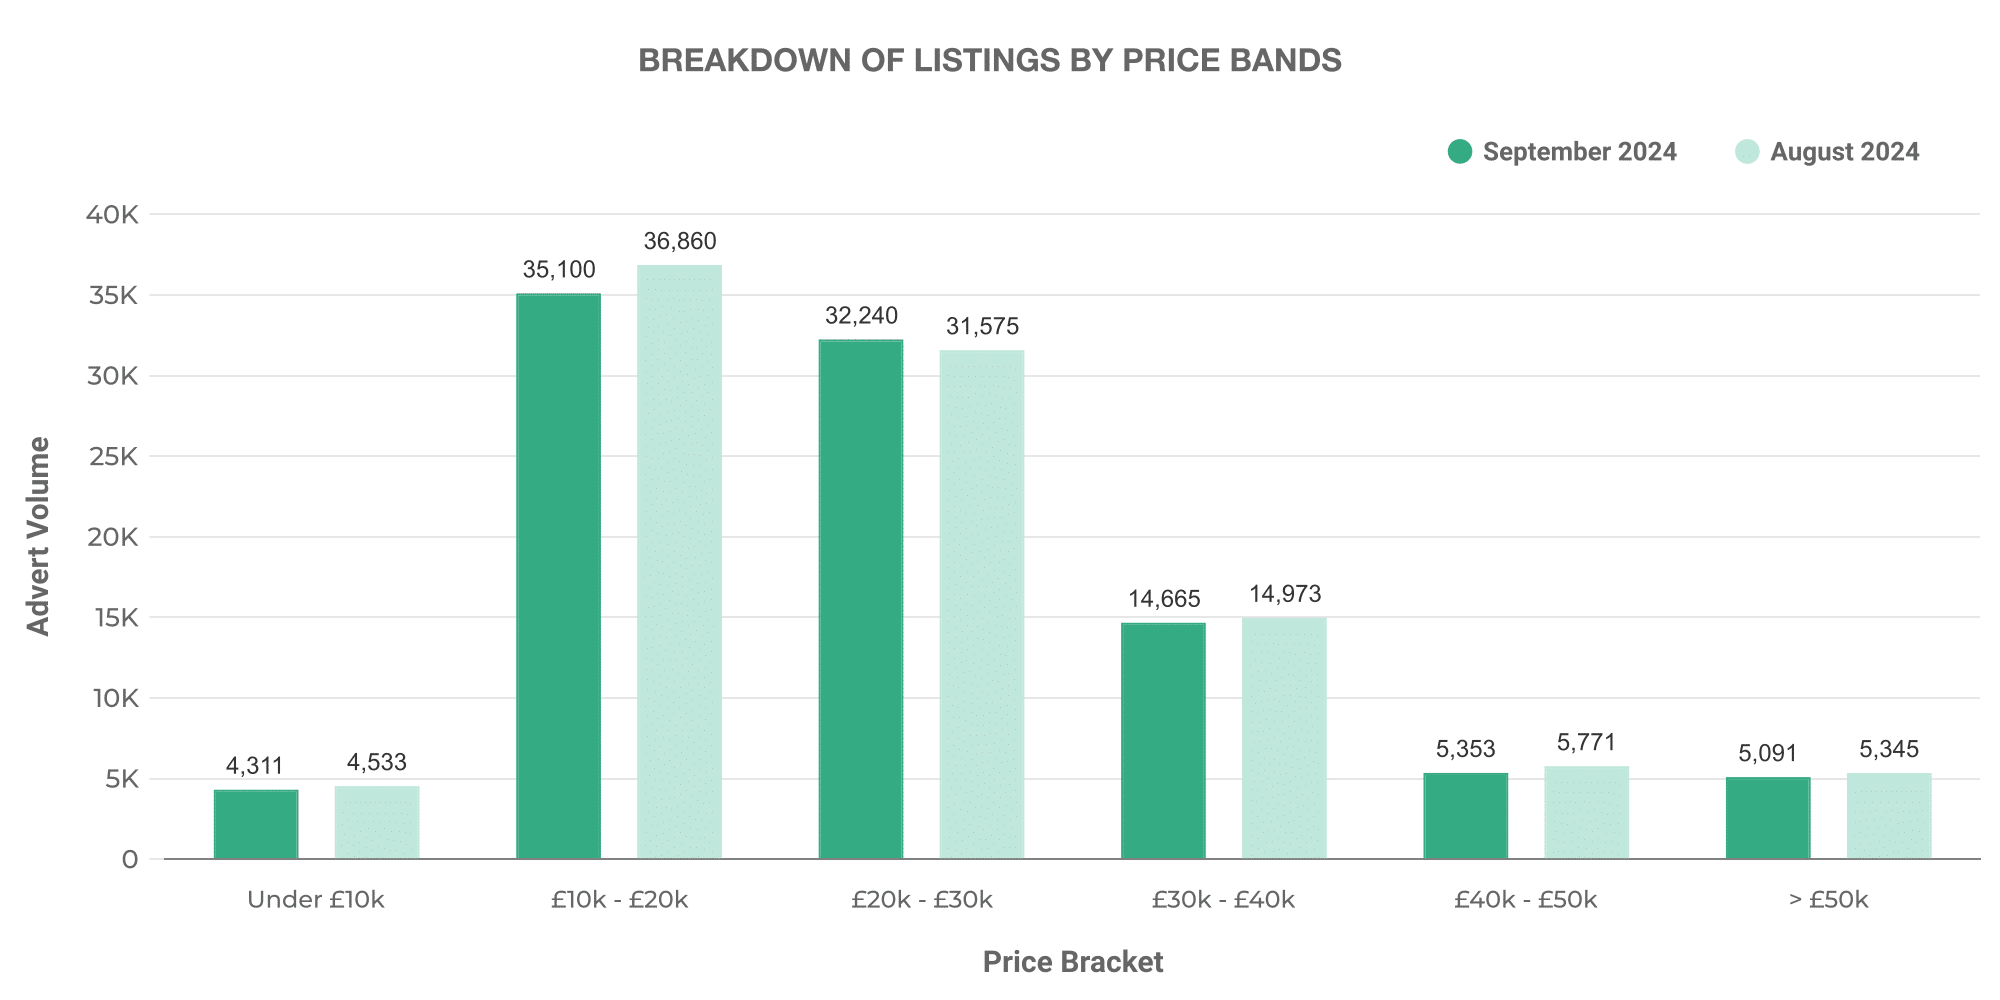
This graph breaks down these listings by price bands. The majority of listed EVs ranged within the £10,000 – £20,000 bracket, followed by a significant number in the £20,000 – £30,000 range. Notably, there were also some luxury models priced above £50,000 contributing to the market.
The increasing diversity in EV pricing is indicative of a growing market, welcoming vehicles of various models, makes, and functionalities to fit different customer requirements.
Hit hard by the trend towards sustainable maturity, the tale of conventional Internal-combustion engine vehicles (ICE) somewhat differs. For the same period, a total of 1,920,444 used ICE cars were listed by 10,841 dealers.
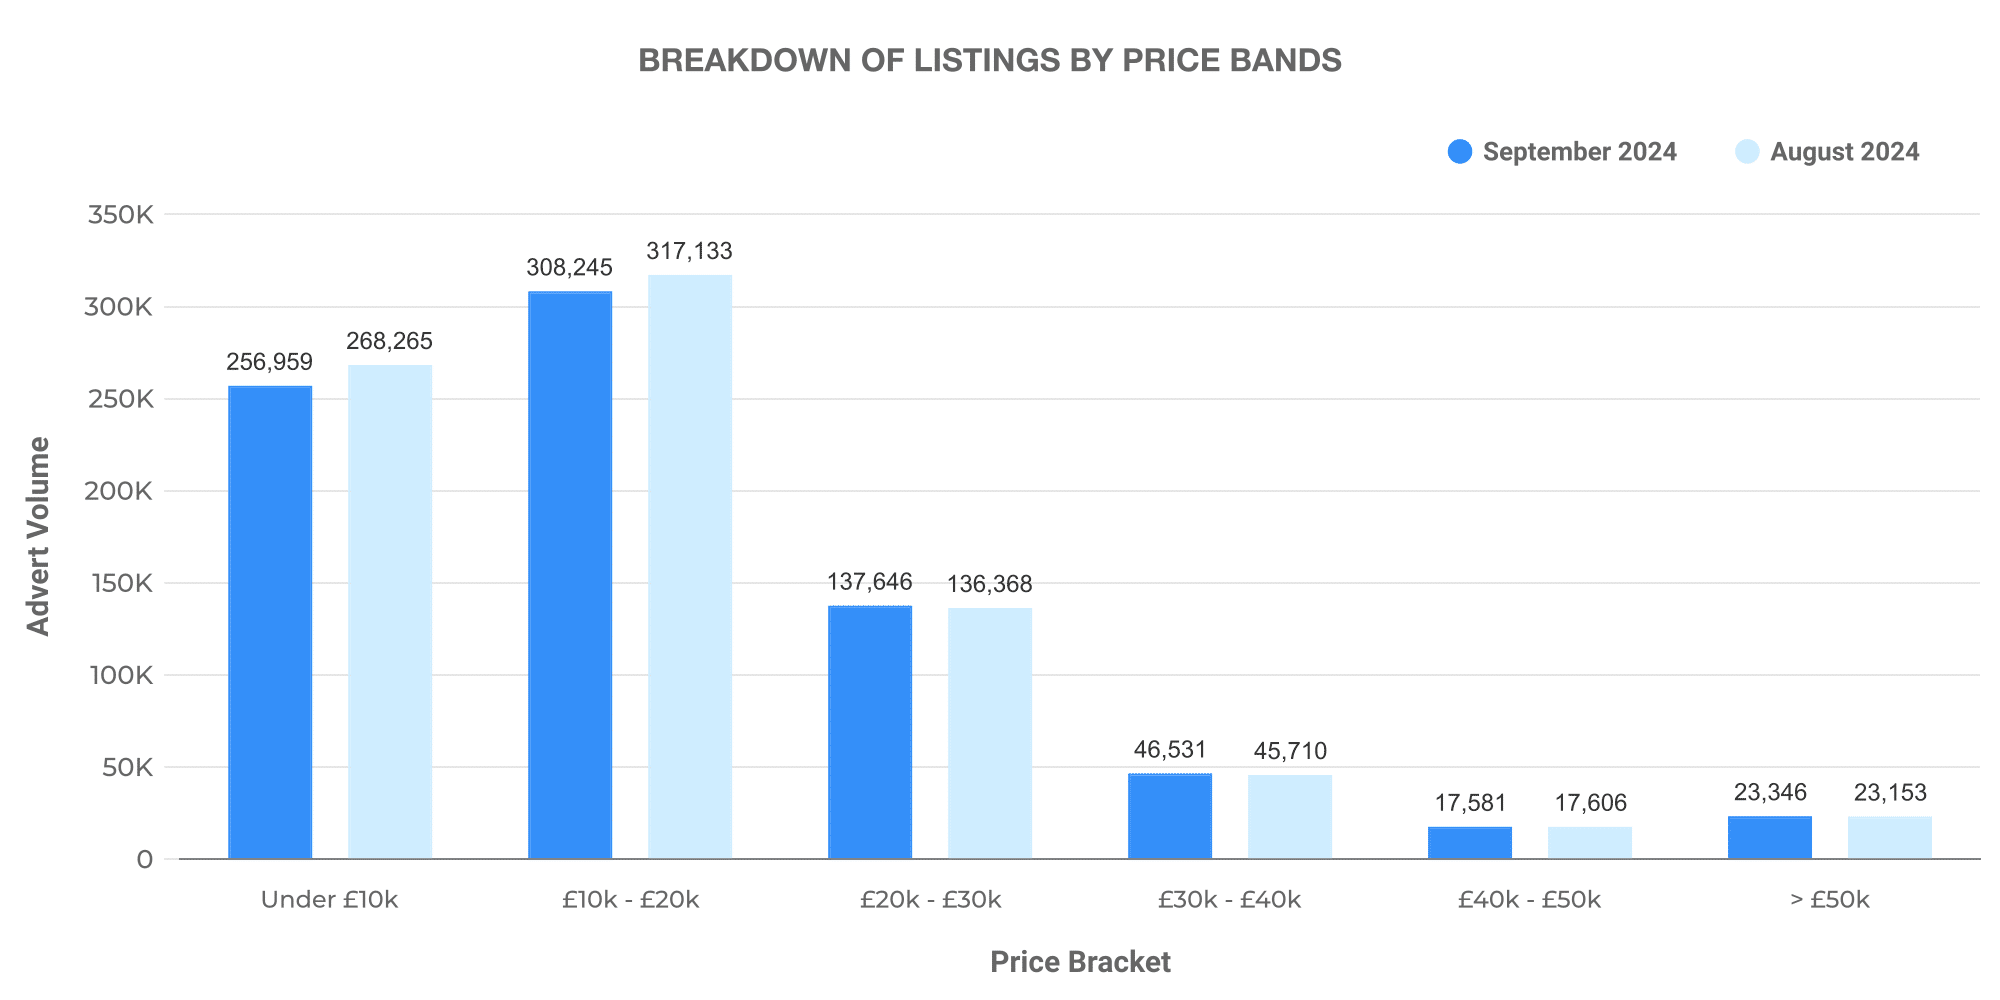
Observing ICE vehicle price bands, a similar pattern of price distribution is visible, with most cars falling within the £10,000 – £20,000 range. However, the average price of listed ICE cars (~£17,788) was noticeably lower compared to EVs (~£26,291).
Dive into Dealer Volume
Analysing the breakdown of dealership volumes provides further clarity.
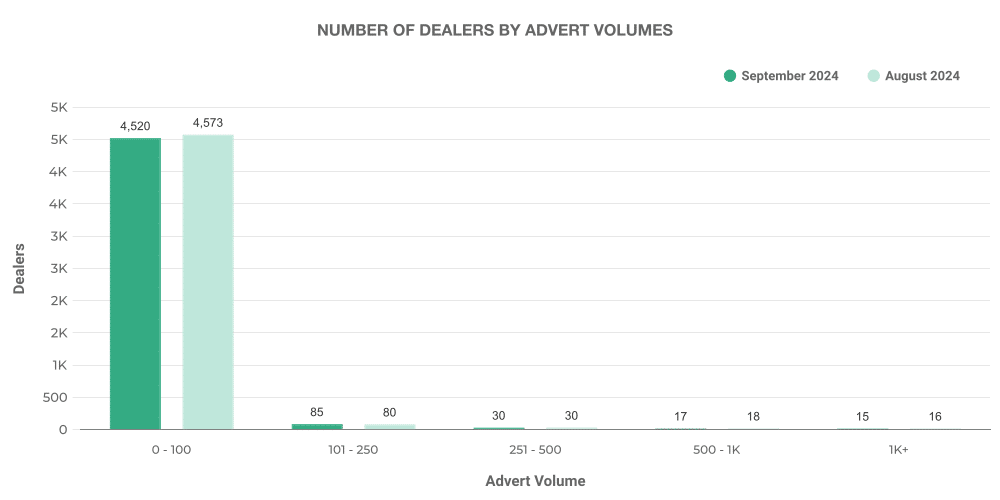
For EVs, most dealers listed between 0-100 vehicles, a prime indicator of the relative novelty in this market in comparison to ICE vehicles.
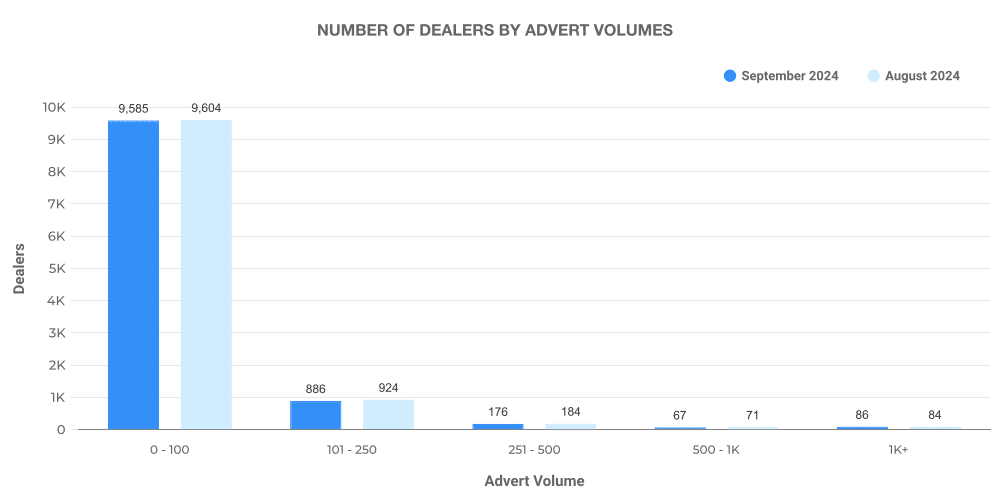
Contrastingly, ICE vehicle listing volumes were more balanced among dealers, reflecting the deeply established nature of this market where dealerships of varying capacities participate.
Top 100 Dealers: ICE vs EV
Here’s an interesting comparison: the analysis of the top 100 dealerships by listing volume for both EVs and ICE vehicles.
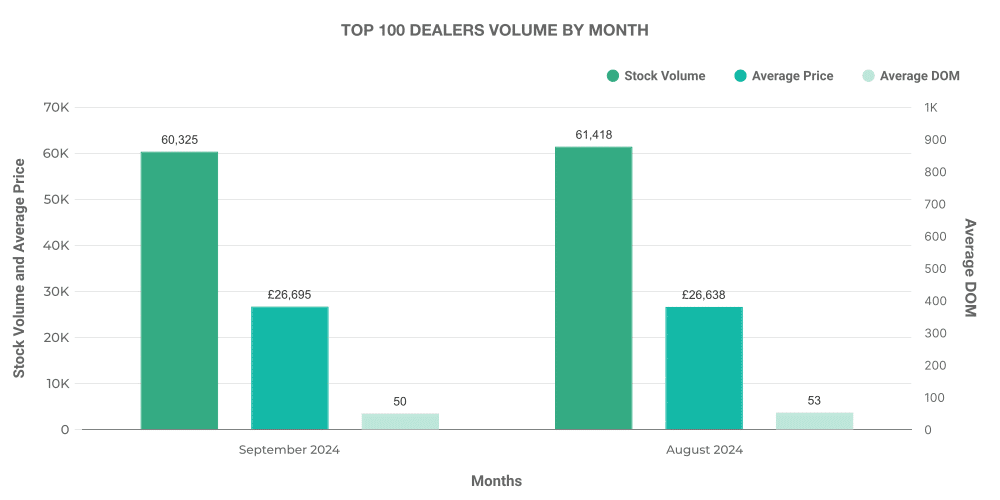
The top 100 dealers accounted for 18.7% of the total EV listings, with an average price slightly higher than the market average.
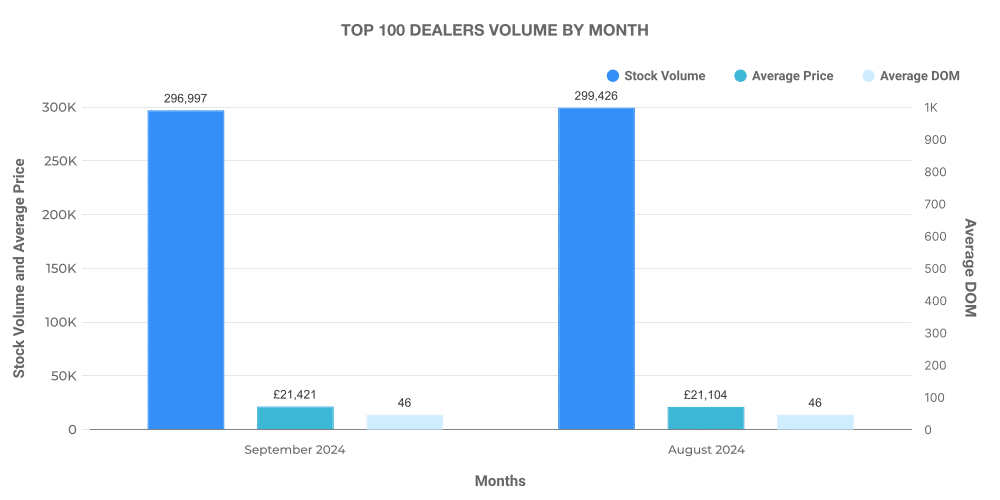
On the other hand, the top 100 dealers in the ICE market accounted for 15.5% of total listings —also selling vehicles with an above-average market price.
Next week: 5th October | Previous week: 28th September
