This week, we dive into the latest June data on used cars-internal combustion engine (ICE) vehicles and electric vehicles (EVs) – to provide automotive dealers with valuable insights into market movements, price trends, and inventory dynamics.
Overview of the Used Car Market (ICE)
Key Metrics and Trends
For the week ending 15th June 2024, the UK used car market saw a slight decrease in total listings, dropping from 876,876 to 872,665. The average days on market (DOM) remained stable at 83 days, indicating consistent demand. The average price of used cars in June also saw a minimal change, moving from £18,057 to £18,030.
Breakdown of Listings by Price Bands
- £0-£10K: 185,787 listings
- £10K-£20K: 220,119 listings
- £20K-£30K: 93,370 listings
- £30K-£40K: 33,731 listings
- £40K-£50K: 13,999 listings
- £50K+: 18,654 listings
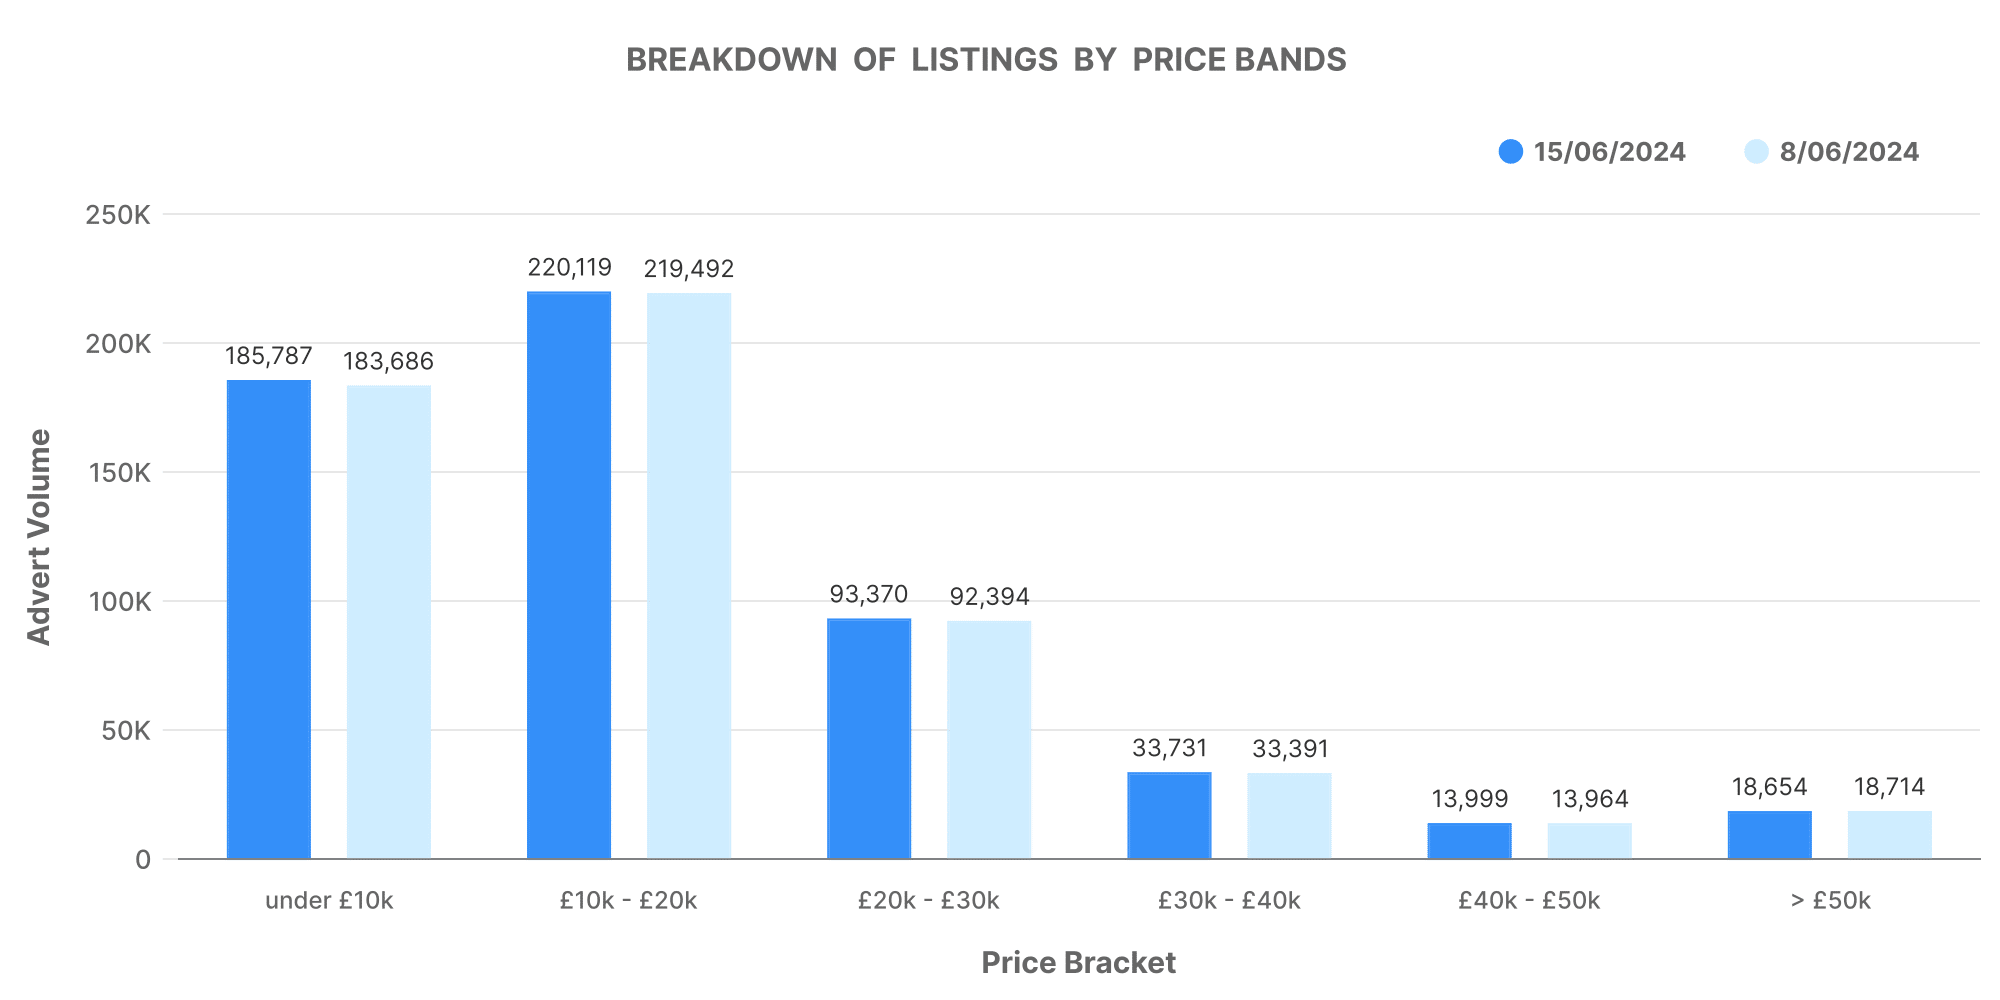
The majority of the used cars in June fall within the £10K-£20K price band, making it the most active segment. This distribution suggests a strong market preference for moderately priced vehicles.
Number of Dealers by Advert Volumes
- 0-100 ads: 9,832 dealers
- 101-250 ads: 543 dealers
- 251-500 ads: 116 dealers
- 501-1000 ads: 66 dealers
- 1000+ ads: 53 dealers
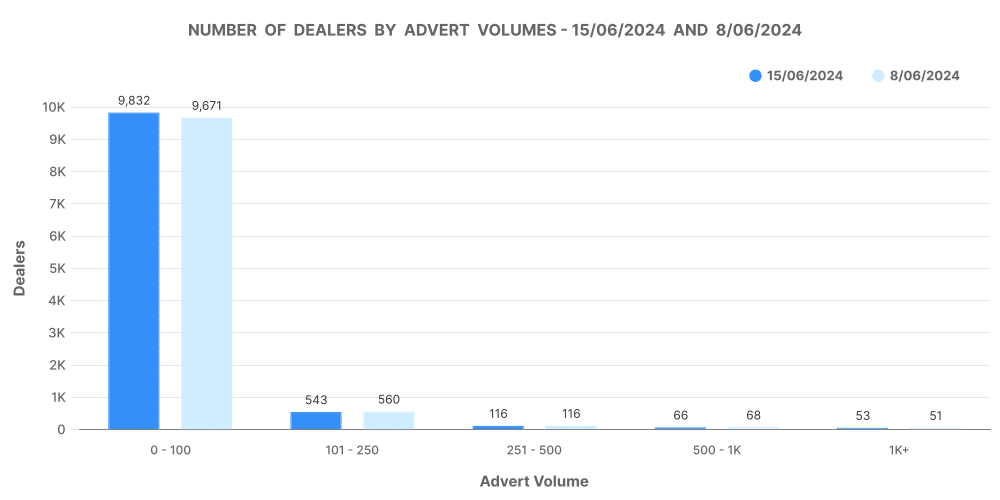
The data shows that most dealers have between 0-100 ads, highlighting the prevalence of smaller dealerships. However, a significant portion of the market is controlled by larger dealerships with 500+ ads, suggesting these players have considerable influence on market trends.
Analysis of Top 100 Dealers by Volume
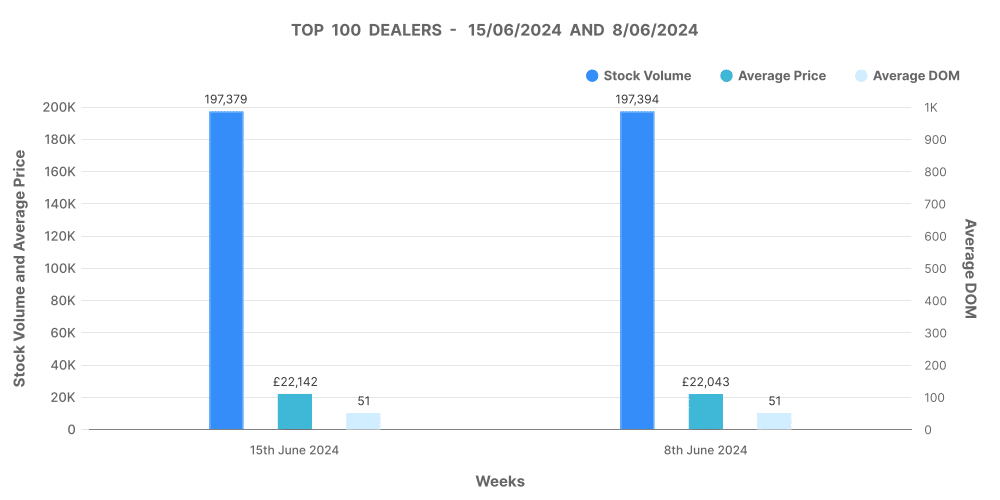
The top 100 dealers have a combined stock volume of 197,379 vehicles, maintaining an average DOM of 51 days and an average price of £22,142. These figures underscore the efficiency and higher price points that top dealers can command compared to the overall market.
Price Adjustments
- Price increases: 17,038
- Price decreases: 61,596
The data indicates that there were significantly more price decreases than increases, reflecting a competitive market where dealers adjust prices to attract buyers.
Marketcheck UK’s Role
Marketcheck UK provides detailed data analysis tools, including APIs, CSV feeds, and analysis tools, enabling dealers to monitor these trends in real time. This allows for swift adjustments in pricing and inventory management to stay competitive.
Overview of the Electric Used Car Market (EV)
Key Metrics and Trends
The electric used car market is gaining traction, though it remains a smaller segment compared to ICE vehicles. This week, the total listings for EVs slightly decreased from 126,336 to 125,451. The average DOM for EVs remained steady at 69 days, with the average price slightly dipping from £27,491 to £27,384.
Breakdown of Listings by Price Bands
- £0-£10K: 2,929 listings
- £10K-£20K: 24,993 listings
- £20K-£30K: 21,417 listings
- £30K-£40K: 11,218 listings
- £40K-£50K: 4,871 listings
- £50K+: 4,559 listings
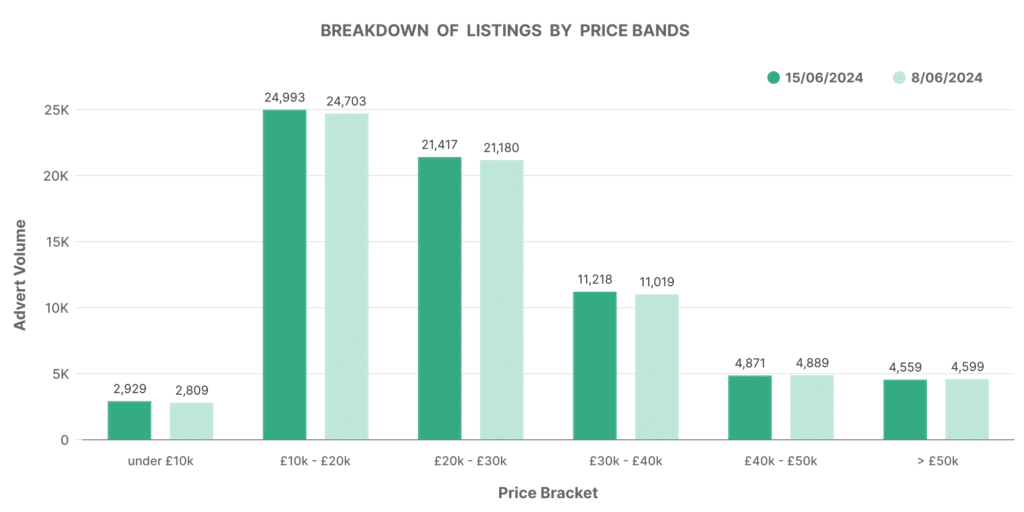
EV listings are more evenly spread across price bands compared to ICE vehicles, with significant volumes in the £10K-£20K and £20K-£30K bands.
Number of Dealers by Advert Volumes
- 0-100 ads: 4,147 dealers
- 101-250 ads: 72 dealers
- 251-500 ads: 20 dealers
- 501-1000 ads: 14 dealers
- 1000+ ads: 10 dealers
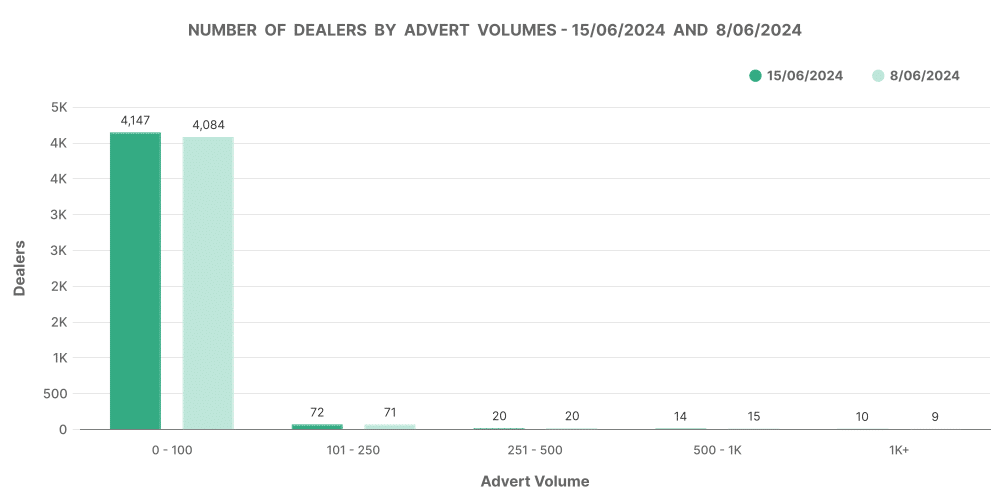
The electric vehicle market is characterised by a higher number of smaller dealerships, with a notable presence of larger dealers, reflecting the growing importance and confidence in the EV market.
Analysis of Top 100 Dealers by Volume
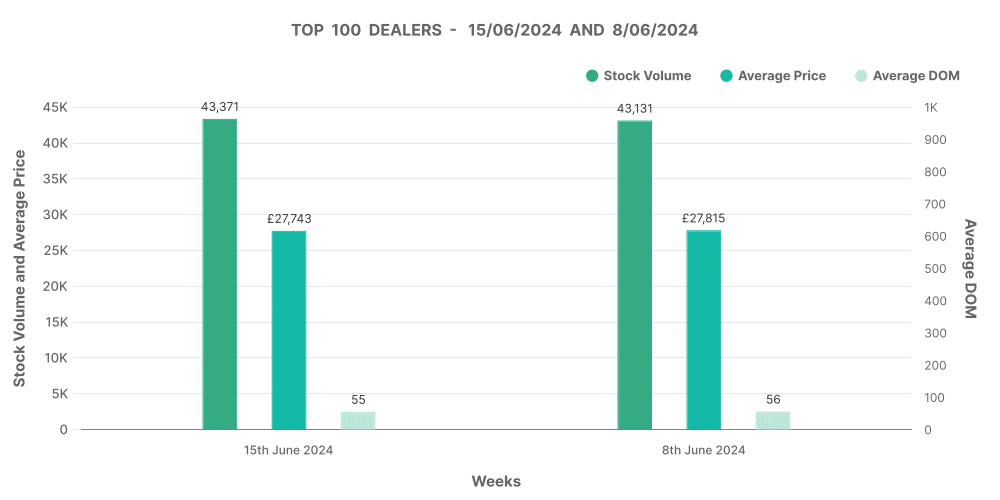
The top 100 EV dealers hold a stock volume of 43,371 vehicles, with an average DOM of 55 days and an average price of £27,743. These figures are indicative of faster turnover and higher price points within the top-performing dealerships.
Price Adjustments
- Price increases: 2,649
- Price decreases: 14,452
Similar to the ICE market, EVs also saw more price decreases than increases, pointing to an active market where pricing strategies are crucial for competitiveness.
Marketcheck UK’s Role
With Marketcheck UK’s data services, dealers can access detailed insights into EV trends, helping them make informed decisions on stocking, pricing, and marketing. This ensures that they can capitalise on the growing demand for electric vehicles and adjust their strategies accordingly.
Comparative Analysis: EV vs. ICE
Market Share and Pricing
- Percentage share of EVs: 12.38%
- Percentage share of non-EVs (ICE): 87.62%
- Average price of EVs: £27,384
- Average price of non-EVs (ICE): £16,709
EVs constitute a smaller but significant portion of the used car market, with higher average prices reflecting their newer technology and increased demand.
Trends and Implications
The steady increase in EV listings and stable prices suggest growing consumer confidence and interest in electric vehicles. This trend is likely to continue as more consumers seek environmentally friendly options and as the infrastructure for EVs improves.
How Marketcheck UK Helps
Marketcheck UK’s comprehensive data on both ICE and EV markets allows dealers to compare performance metrics, price trends, and inventory dynamics. By leveraging this data, dealers can optimise their strategies to cater to both segments effectively.
