This week, we’ll delve into the latest used car market data from Marketcheck UK in June, providing insights into both the internal combustion engine (ICE) and electric vehicle (EV) markets. By understanding these trends, dealers can better position themselves to meet customer demands and maximise profits.
Breakdown of Listings by Price Bands
ICE Vehicles
For the week ending 22nd June 2024, the total number of ICE vehicle listings slightly increased from 872,665 to 876,470. The distribution of these listings across various price bands is as follows:
- £0-10K: 188,065 vehicles
- £10-20K: 218,511 vehicles
- £20-30K: 93,570 vehicles
- £30-40K: 33,815 vehicles
- £40-50K: 13,951 vehicles
- £50K+: 18,475 vehicles
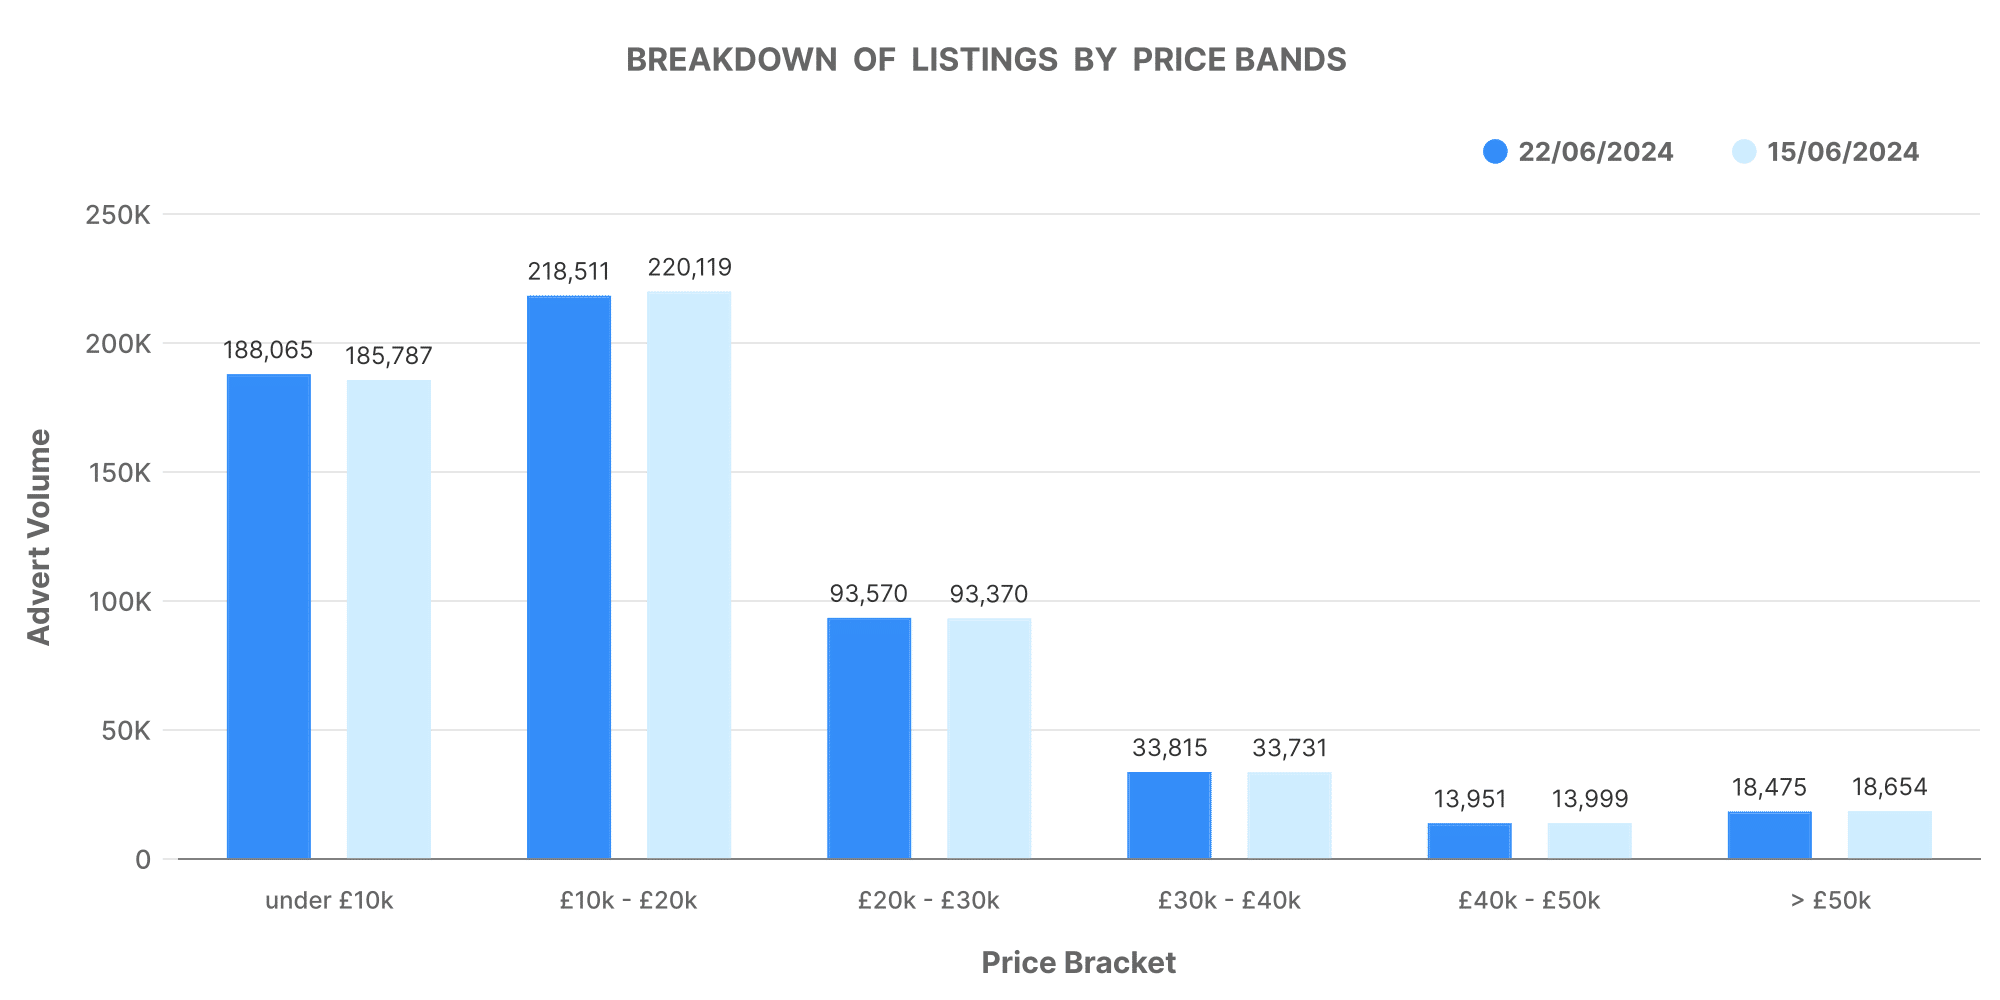
This breakdown shows a higher concentration of listings in the lower to mid-range price bands, indicating a robust market for more affordable vehicles. This could reflect consumer preferences for budget-friendly options or a larger supply of such vehicles.
EV Vehicles
In the EV market, the total listings rose from 125,451 to 127,585, maintaining a steady increase. The price band distribution for EVs is as follows:
- £0-10K: 3,010 vehicles
- £10-20K: 24,699 vehicles
- £20-30K: 21,305 vehicles
- £30-40K: 11,242 vehicles
- £40-50K: 4,800 vehicles
- £50K+: 4,491 vehicles
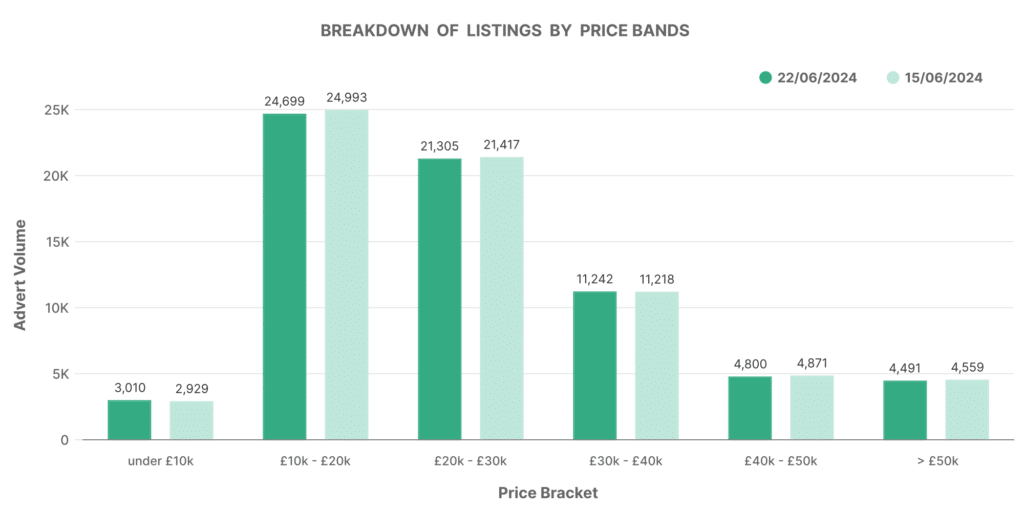
Interestingly, the EV market shows a significant number of vehicles in the £10-30K range, indicating a growing market for mid-range electric cars. This trend suggests that EVs are becoming more accessible to the average consumer, which could drive future demand.
Number of Dealers by Advert Volumes
ICE Vehicles
The data indicates that the total number of dealers increased from 10,661 to 10,828, with most dealerships managing smaller inventories:
- 0-100 vehicles: 9,991 dealers
- 101-250 vehicles: 563 dealers
- 251-500 vehicles: 112 dealers
- 500-1,000 vehicles: 65 dealers
- 1,000+ vehicles: 52 dealers
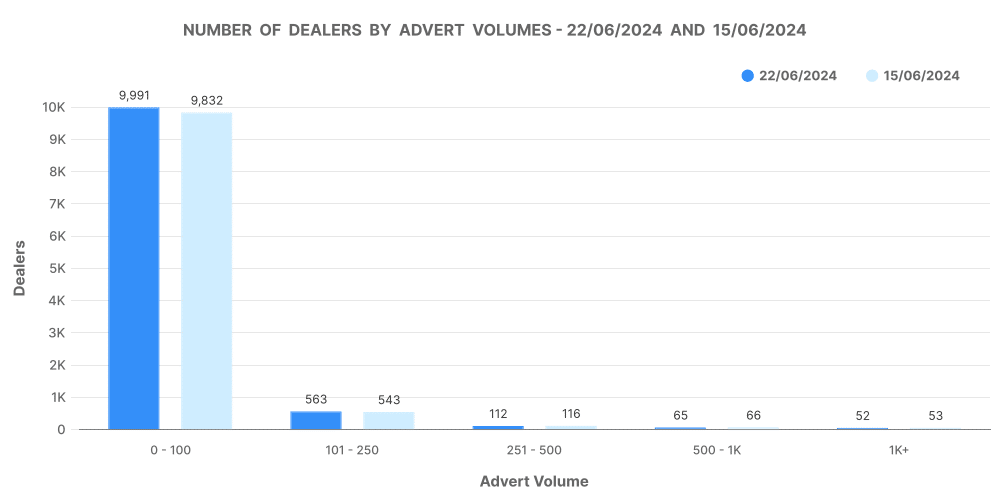
This distribution highlights that the majority of ICE vehicle dealers operate on a smaller scale, with less than 100 vehicles in their inventory. This could be due to the capital-intensive nature of maintaining a large stock of ICE vehicles.
EV Vehicles
For EVs, the number of dealers increased slightly from 4,372 to 4,416. The distribution of dealers by advert volumes is as follows:
- 0-100 vehicles: 4,183 dealers
- 101-250 vehicles: 74 dealers
- 251-500 vehicles: 21 dealers
- 500-1,000 vehicles: 13 dealers
- 1,000+ vehicles: 10 dealers
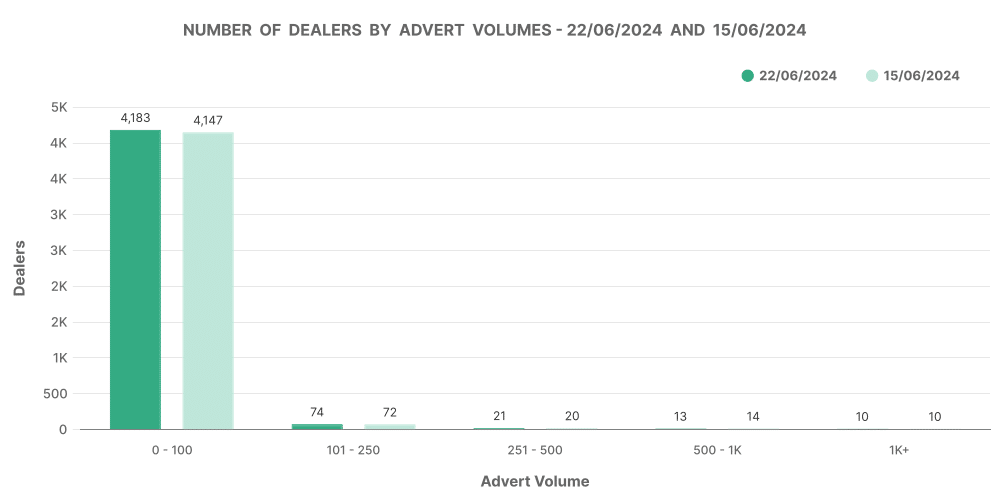
Similar to the ICE market, most EV dealers manage smaller inventories. However, the proportion of dealers with larger stocks is slightly higher in the EV market, reflecting the increasing focus and investment in electric vehicles.
Analysis of Top 100 Dealers by Volume
ICE Vehicles
The top 100 ICE vehicle dealers hold a significant portion of the market, with the following statistics:
- Stock volume: 198,059 vehicles
- Average days on market (DOM): 51 days
- Average price: £21,993
- Price increases: 12,555 listings
- Price decreases: 66,175 listings
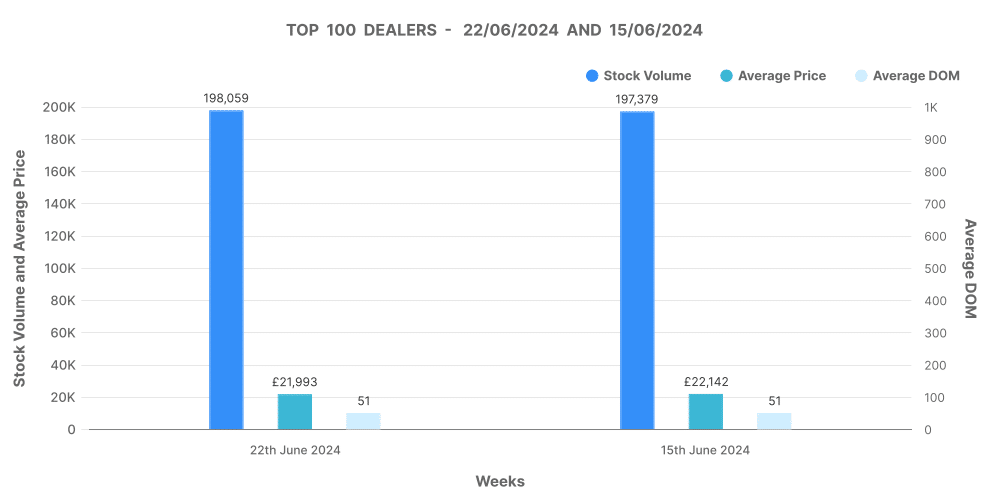
The top 100 dealers have a quicker turnover, with vehicles spending fewer days on the market and maintaining a higher average price compared to the broader market. This indicates that these dealers are likely employing effective pricing and marketing strategies to attract buyers quickly.
EV Vehicles
For the top 100 EV dealers:
- Stock volume: 43,018 vehicles
- Average DOM: 55 days
- Average price: £27,730
- Price increases: 2,475 listings
- Price decreases: 15,884 listings
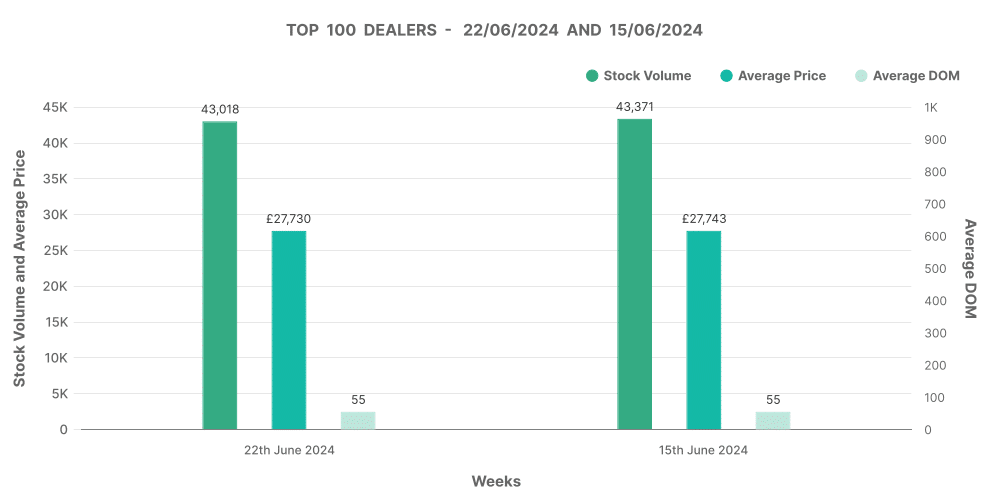
EV dealers in the top 100 also show a healthy turnover, though the average days on market is slightly higher than for ICE vehicles. This could be due to the higher average price of EVs, which may require more time to find the right buyers.
Comparing EV and ICE Markets
Inventory and Price Trends
The percentage share of EVs in the UK used car market in June is currently 12.27%, with the remaining 87.73% being ICE vehicles. The average price for EVs is significantly higher at £27,346.62, compared to £16,659.34 for ICE vehicles. This price gap highlights the premium still associated with electric vehicles, though the growing inventory in the £10-30K range suggests increasing affordability.
Market Dynamics
The UK used car market data in June indicates a steady growth in both ICE and EV listings, with EVs gradually increasing their market share. The higher average price and slightly longer days on market for EVs reflect their evolving market dynamics as consumers become more accustomed to electric vehicles.
Relevance of Marketcheck UK Data
For UK automotive dealers, staying ahead in this competitive market requires access to comprehensive and up-to-date data. Marketcheck UK provides invaluable insights into the used car market, allowing dealers to:
- Track market trends and pricing strategies
- Understand inventory dynamics and adjust accordingly
- Identify high-demand vehicles and adjust stock
- Make informed decisions based on real-time data
By leveraging Marketcheck UK’s extensive database and analysis tools, dealers can optimise their operations, improve their sales strategies, and ultimately boost profitability. Whether through CSV feeds, APIs, website tools, or third-party integrations, Marketcheck UK delivers the data solutions that automotive dealers need to thrive in a dynamic market.
