UK Weekly Used Car Market Data – April 2024
Tracing the ebbs and flows in the used car industry is a fundamental concern for all stakeholders related to the UK automotive sector. Recognising these trends can provide valuable automotive market insights, enabling dealers, insurance companies, and car finance lenders to better formulate growth strategies. This report will delve into the current status of the UK used car market, giving special attention not only to traditional internal-combustion engine (ICE) vehicles but also to the ever-growing electric used car market (EV).
The Shift Towards Electric in the Used Car Market
For quite some time, there has been a visible shift towards electric cars on the roads of the UK. As the week ending 19th April, 2024 concludes, a comprehensive review of the key metrics that outlined this week is discussed below.
According to our automotive inventory data, a total of 99,573 used electric vehicles (EV) were listed by 4,751 dealers during the week.
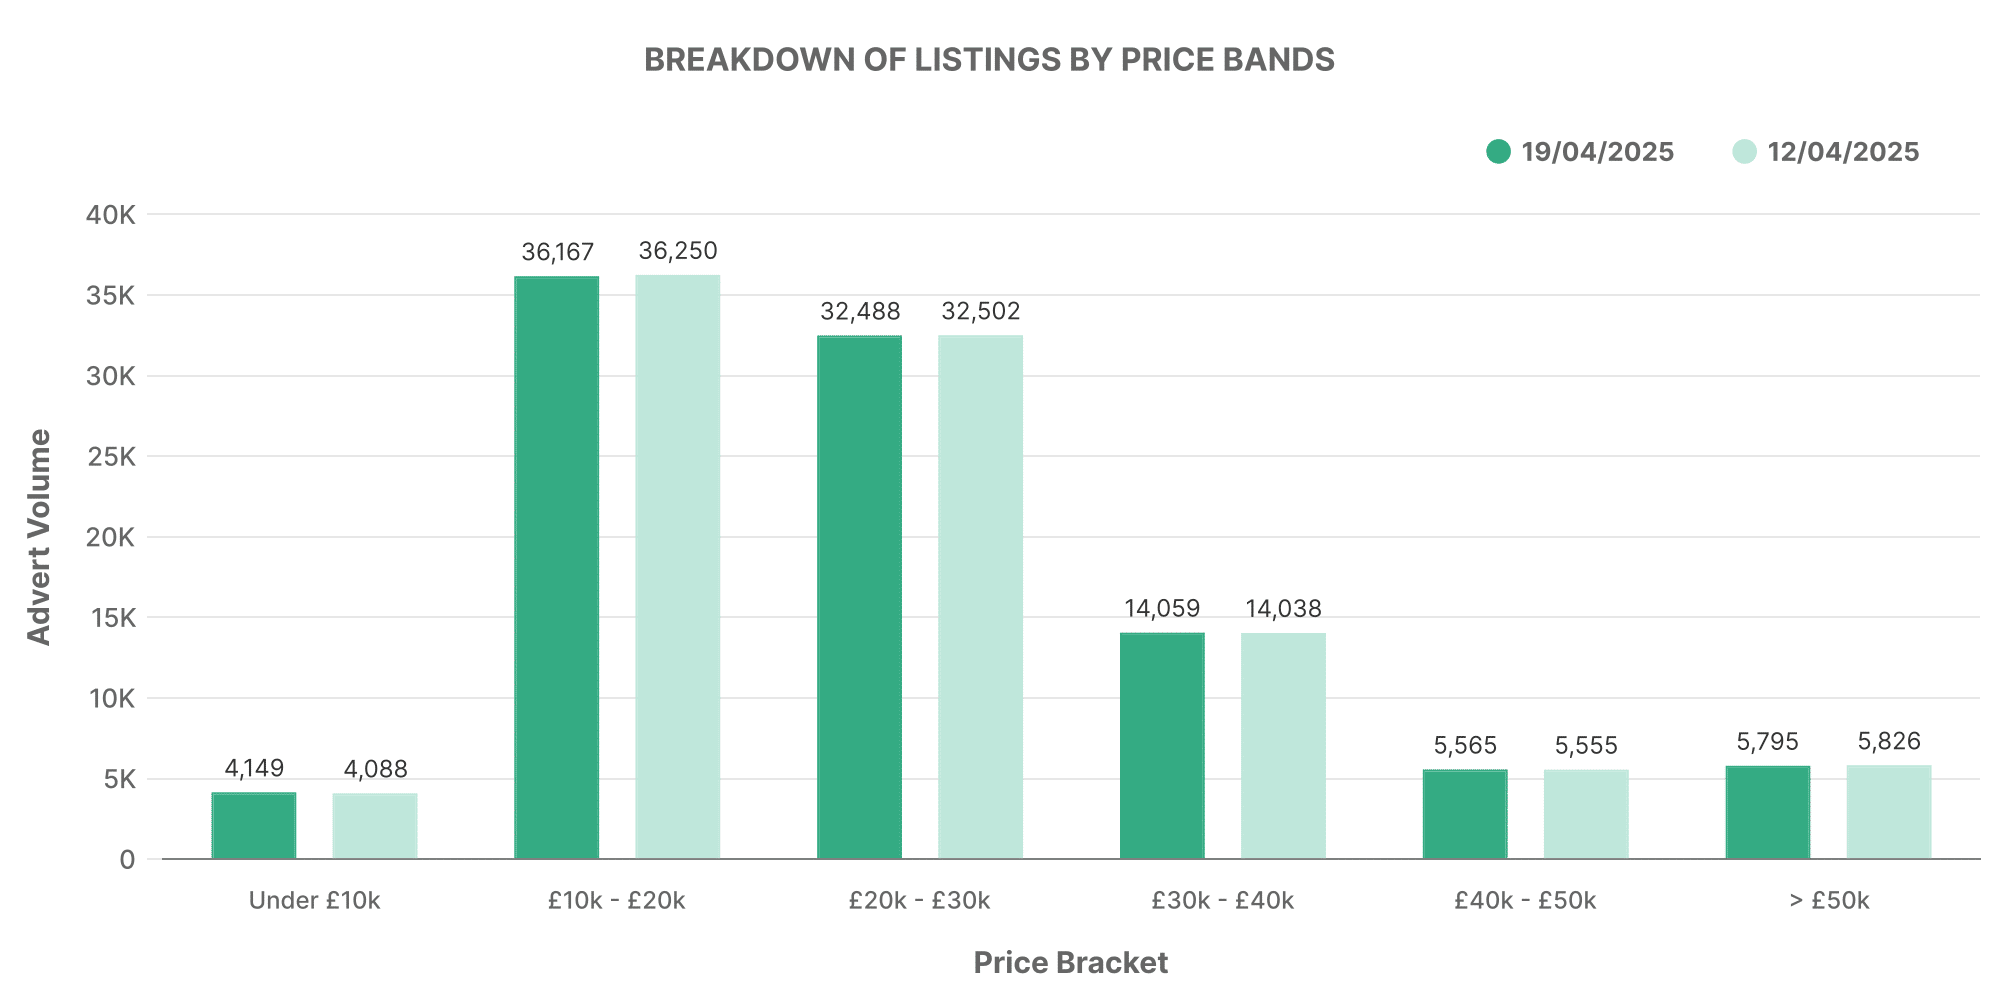
Our data reveals that most of the EVs listed fell within the £10,000 – £20,000 price range, similar to previous weeks. There also appears to be an increased demand for luxury models priced over £50,000. The steady growth in EV pricing data shows a maturing market that caters to various models, makes, and needs for different customers.
The Dynamics of the Traditional ICE Market
The narrative for conventional internal-combustion engine vehicles (ICE) contrasts with that of the electric vehicle market. The same period showcased a total of 622,894 used ICE cars listed by 10,699 dealers.
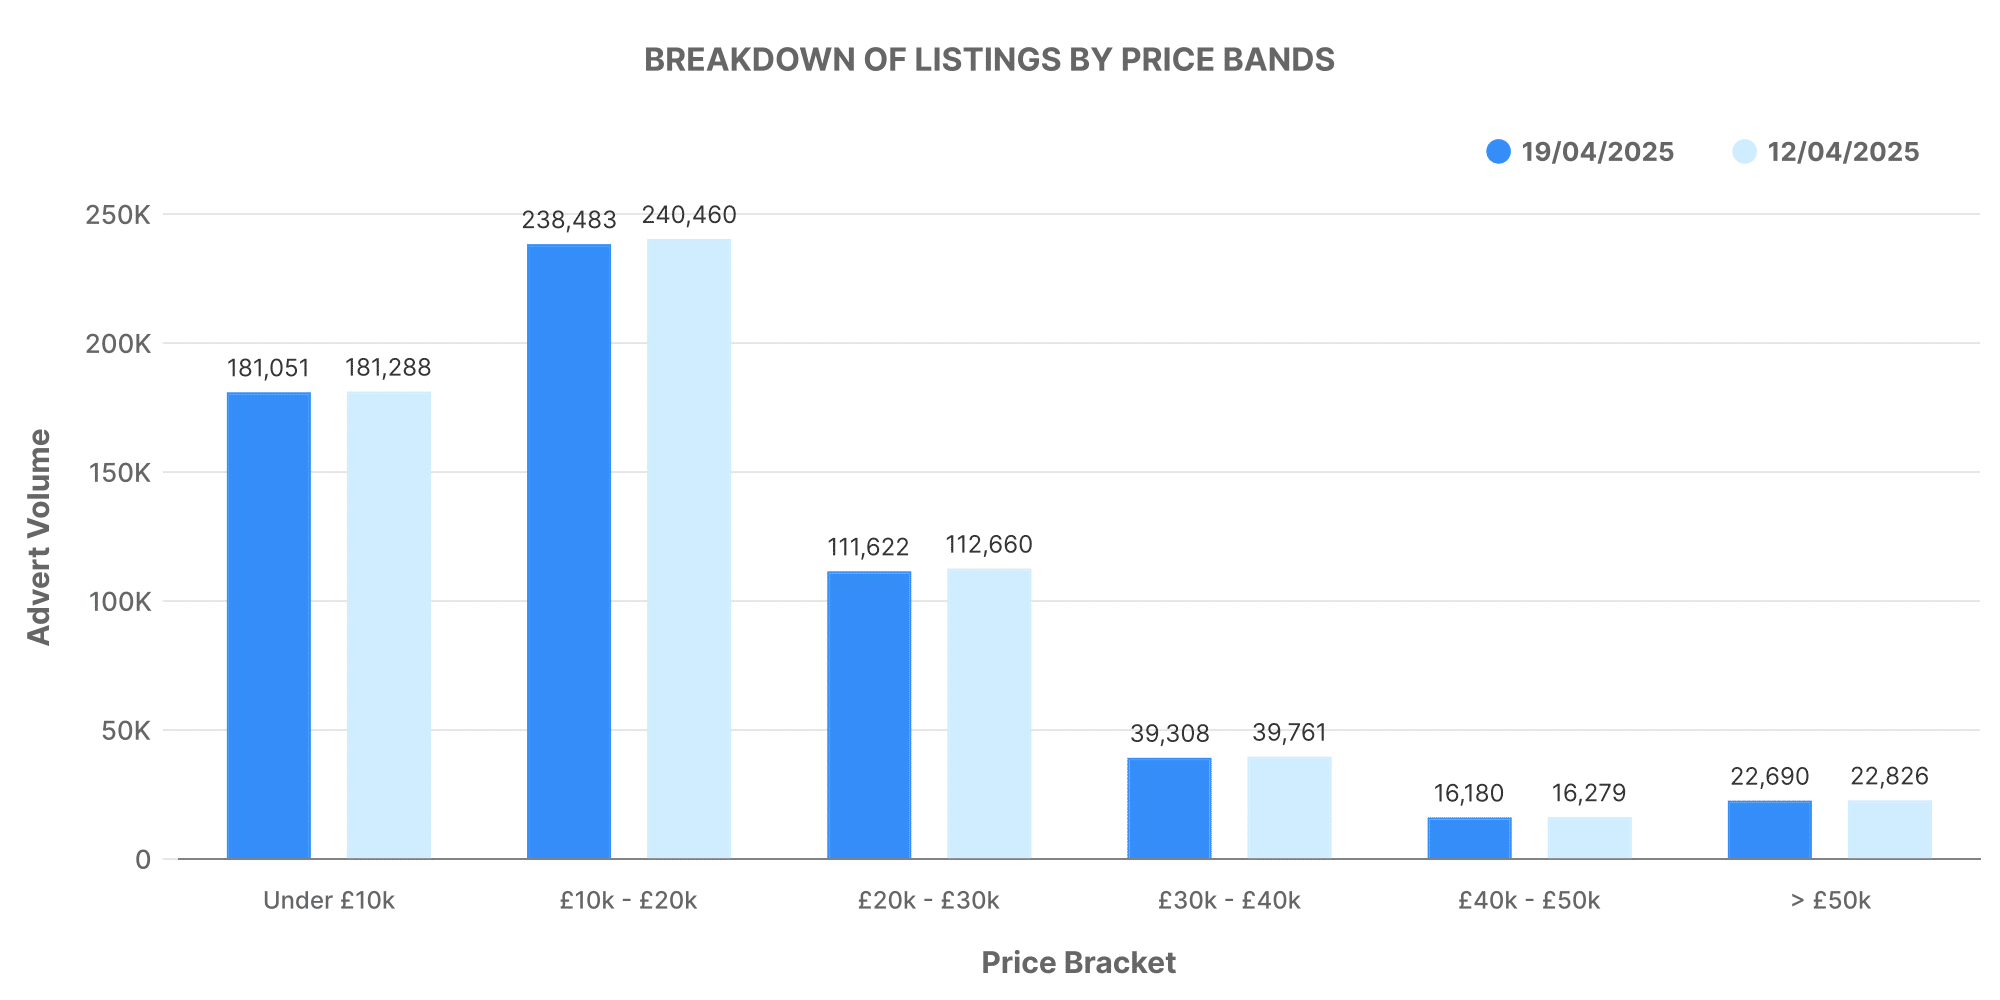
Analysing ICE vehicle price bands reveals a familiar pattern, with most cars falling within the £10,000 – £20,000 category. However, it’s worth noting that the average price of listed ICE cars sits at approximately £18930, which is lower when compared to EVs showing an average of £26,552.
Analysing Dealers’ Listings
Taking a deeper look at the data around dealership volumes can shed more light on the situation.
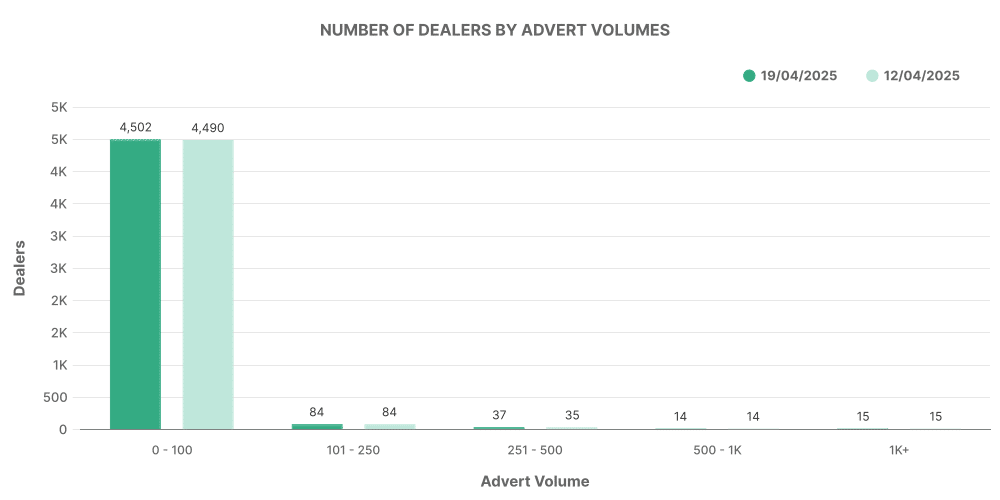
According to our data, the majority of dealers listed between 0-100 electric vehicles. This observation highlights the relative novelty of the electric market compared to traditional ICE vehicles.
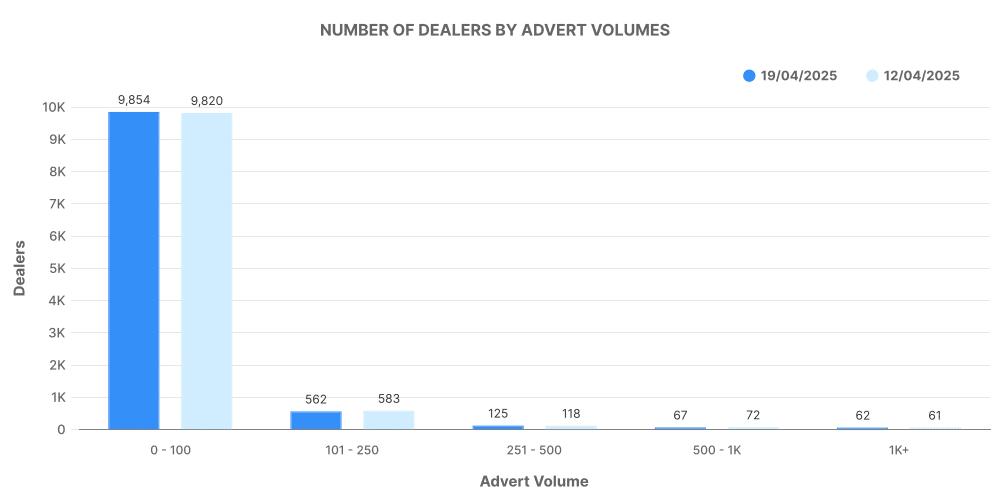
On the other hand, the volume of ICE vehicle listings was more dispersed, showing a presence of dealerships of all sizes. It reinforces the deeply ingrained nature of this market.
Comparison: ICE vs EV
The comparison between the top 100 dealerships by listing volume for both EVs and ICE vehicles presents an interesting picture.
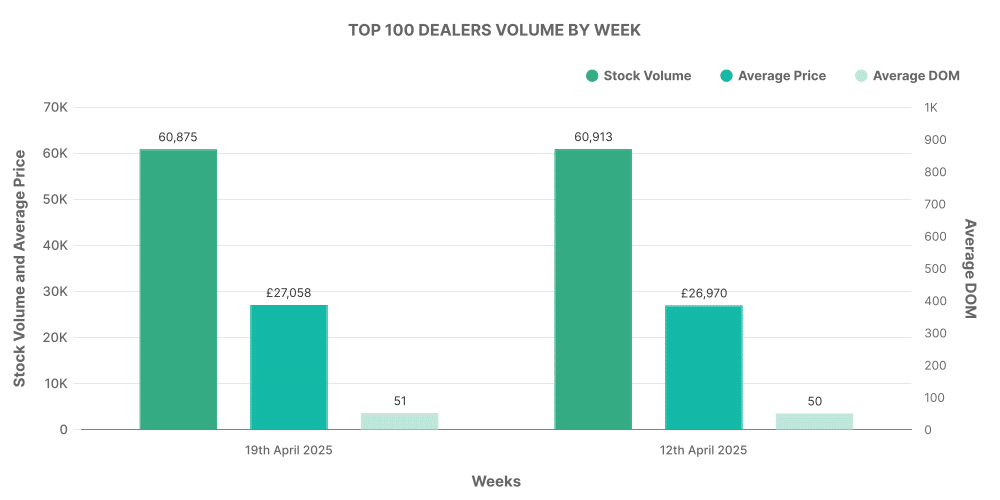
Data suggests that for EVs, the top 100 dealers accounted for 61.10% of all EV listings with an average price slightly higher than the market average.
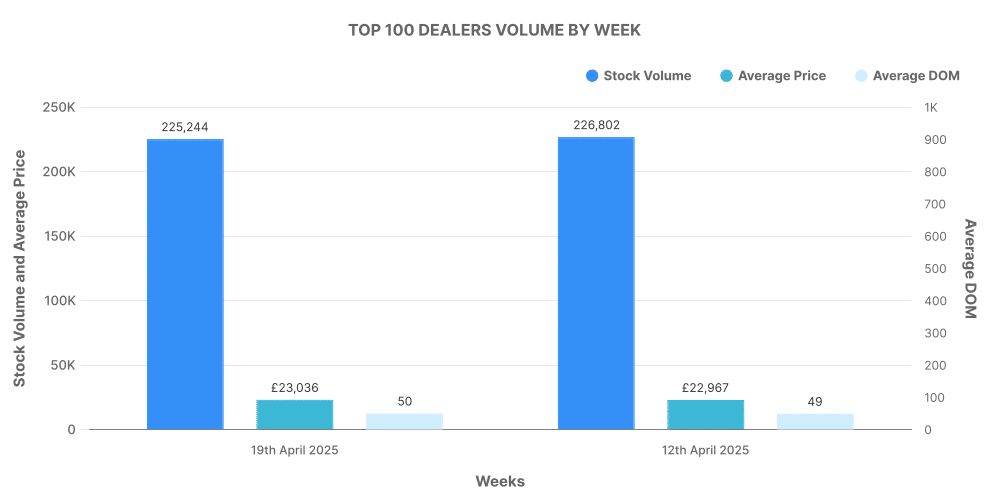
In contrast, the top 100 dealers in the traditional ICE market accounted for 36.20% of total ICE listings — selling vehicles that are priced slightly above the market average.
The analysis of UK car price trends, both for ICE vehicles and EVs, provide invaluable insights for all enterprises operating in the UK automotive domain. These trends help companies make data-driven decisions, optimise their strategies and exploit new growth opportunities in the used car market.
Please reach out to Marketcheck UK for detailed automotive inventory data, comprehensive market analysis and high-quality SEO-optimised content to support your business growth. We offer our proprietary data via CSV feeds, APIs, Spreadsheets, and analysis tools.
