UK Weekly Used Car Market Data – April 2026
In this report, we’ll focus on the critical areas and changes in automotive trends over the week commencing on the 19th April and ending on the 26th April 2026. Reliant on our proprietary automotive inventory data, we’ll examine the vital statistics around the Internal Combustion Engine (ICE) cars and delve into the increasingly significant Electric Used Car Market (EV) trends and statistics.
Used Car Market (ICE)
Over the week period, a total of 604,040 used ICE cars were listed by 10,695 dealers across the United Kingdom, with the average price ranging around £18,908. Highlighted in the graph below, the majority of the cars listed for sale fell into the £10,000–£20,000 price bracket, while a few ranged above £50,000, adding diversity to the market.
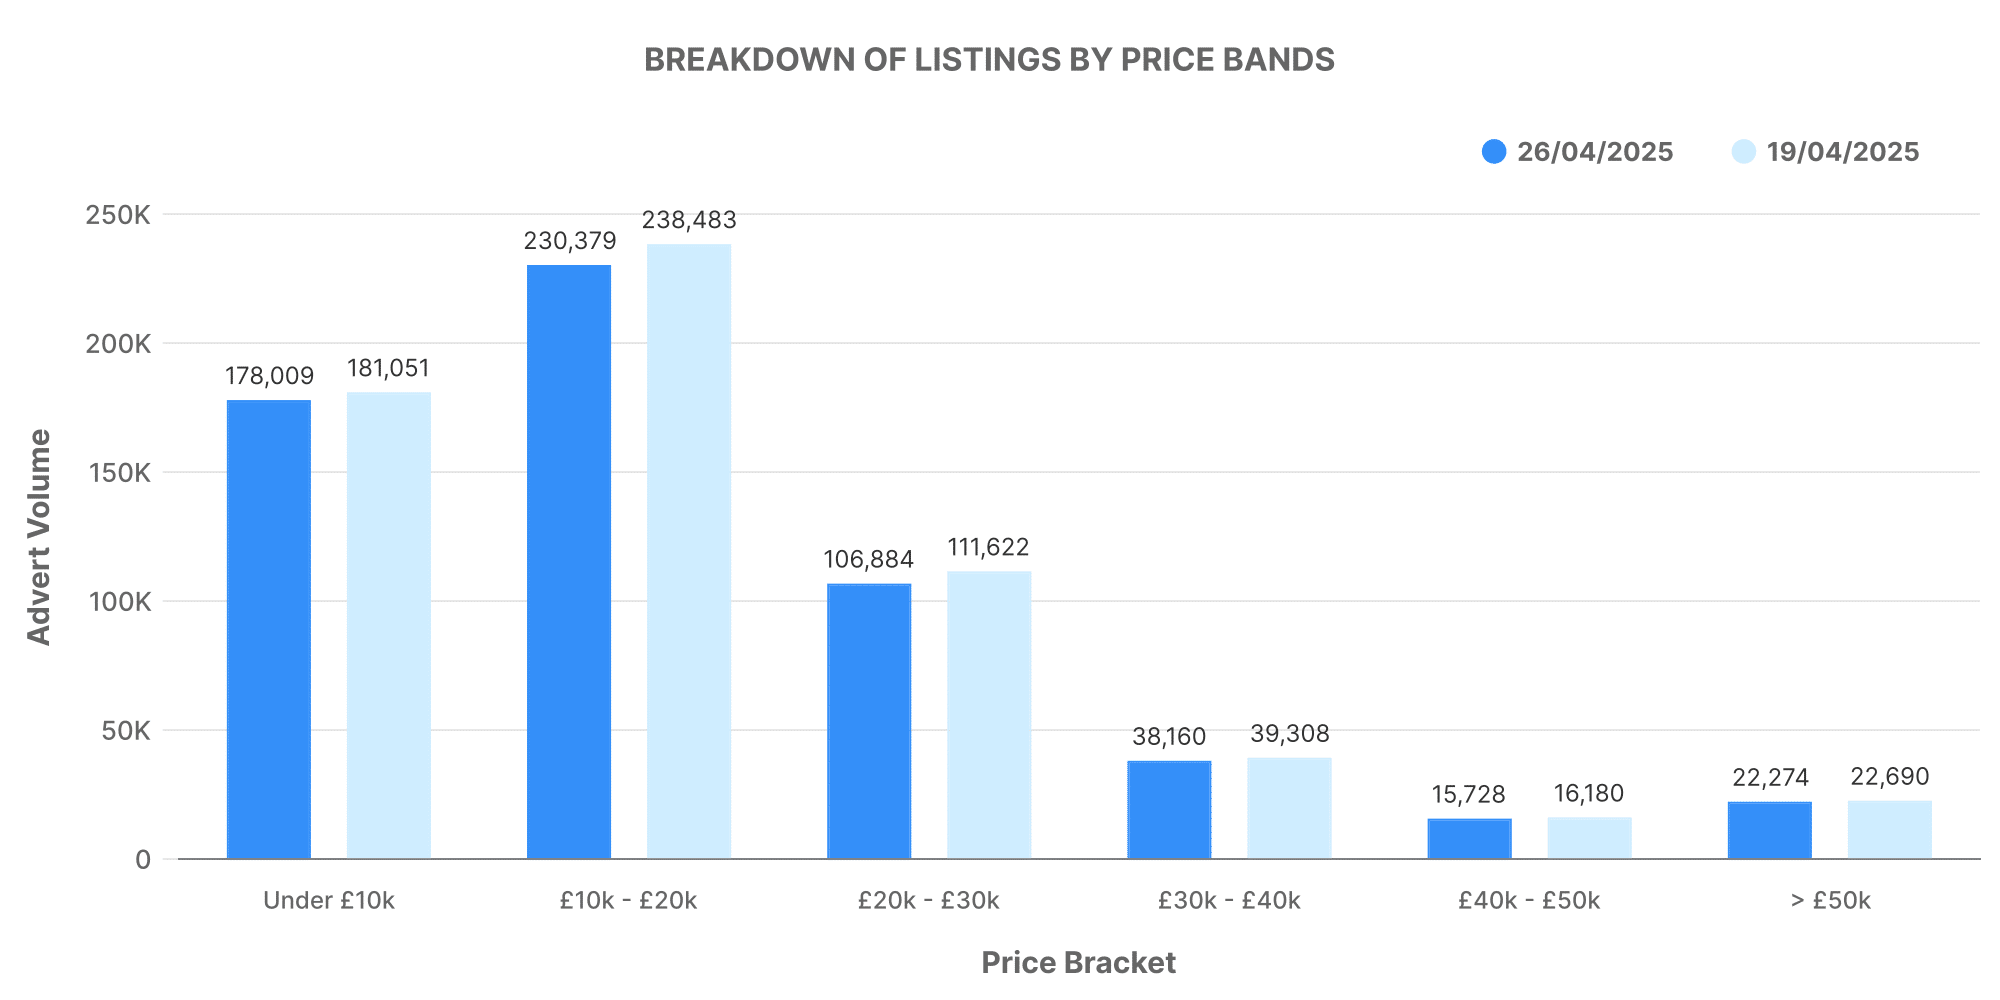
Looking at the volume of cars listed by dealerships, the graph below provides a clearer picture.
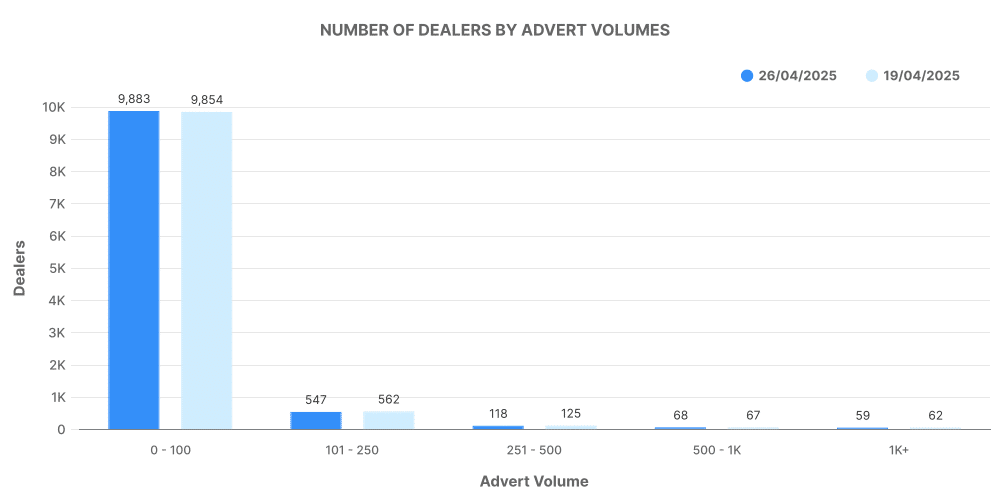
Above we can see most dealers listed more than 500 vehicles per week, showing the well-established nature of the ICE car market. It paints a widely balanced picture across the industry, with a significant volume of high and low capacity dealerships across the UK.
Then there’s a comparison between the top 100 dealerships and the rest of the market, as shown in the graph below.
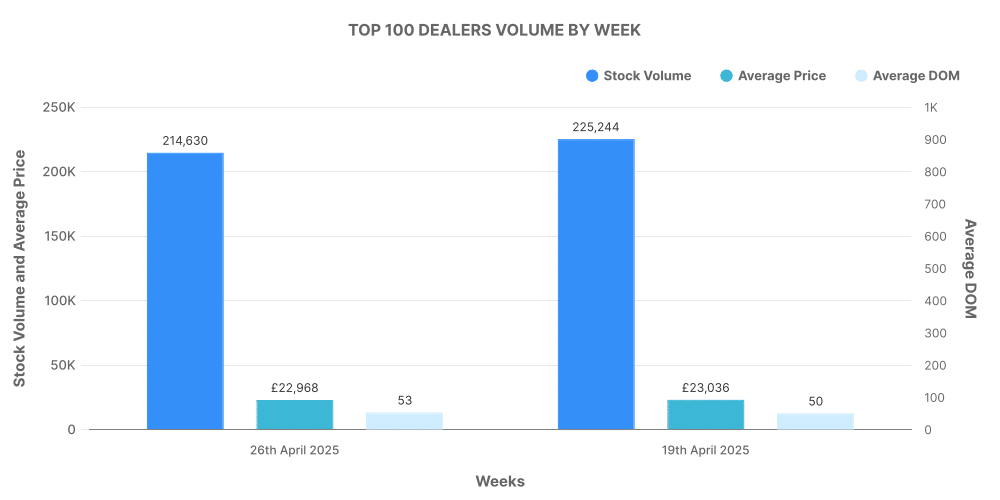
The top 100 dealerships accounted for about 15% of the total ICE used car listings and had an average list price slightly higher than the market average.
Electric Used Car Market (EV)
A total of 96,118 electric used cars were posted by 4,716 dealers with the average pricing for an EV used car was £26,607. More affordable models priced £10,000 – £30,000 made up the majority of the listed cars, with a few high-end models priced above £50,000 contributing to the market.
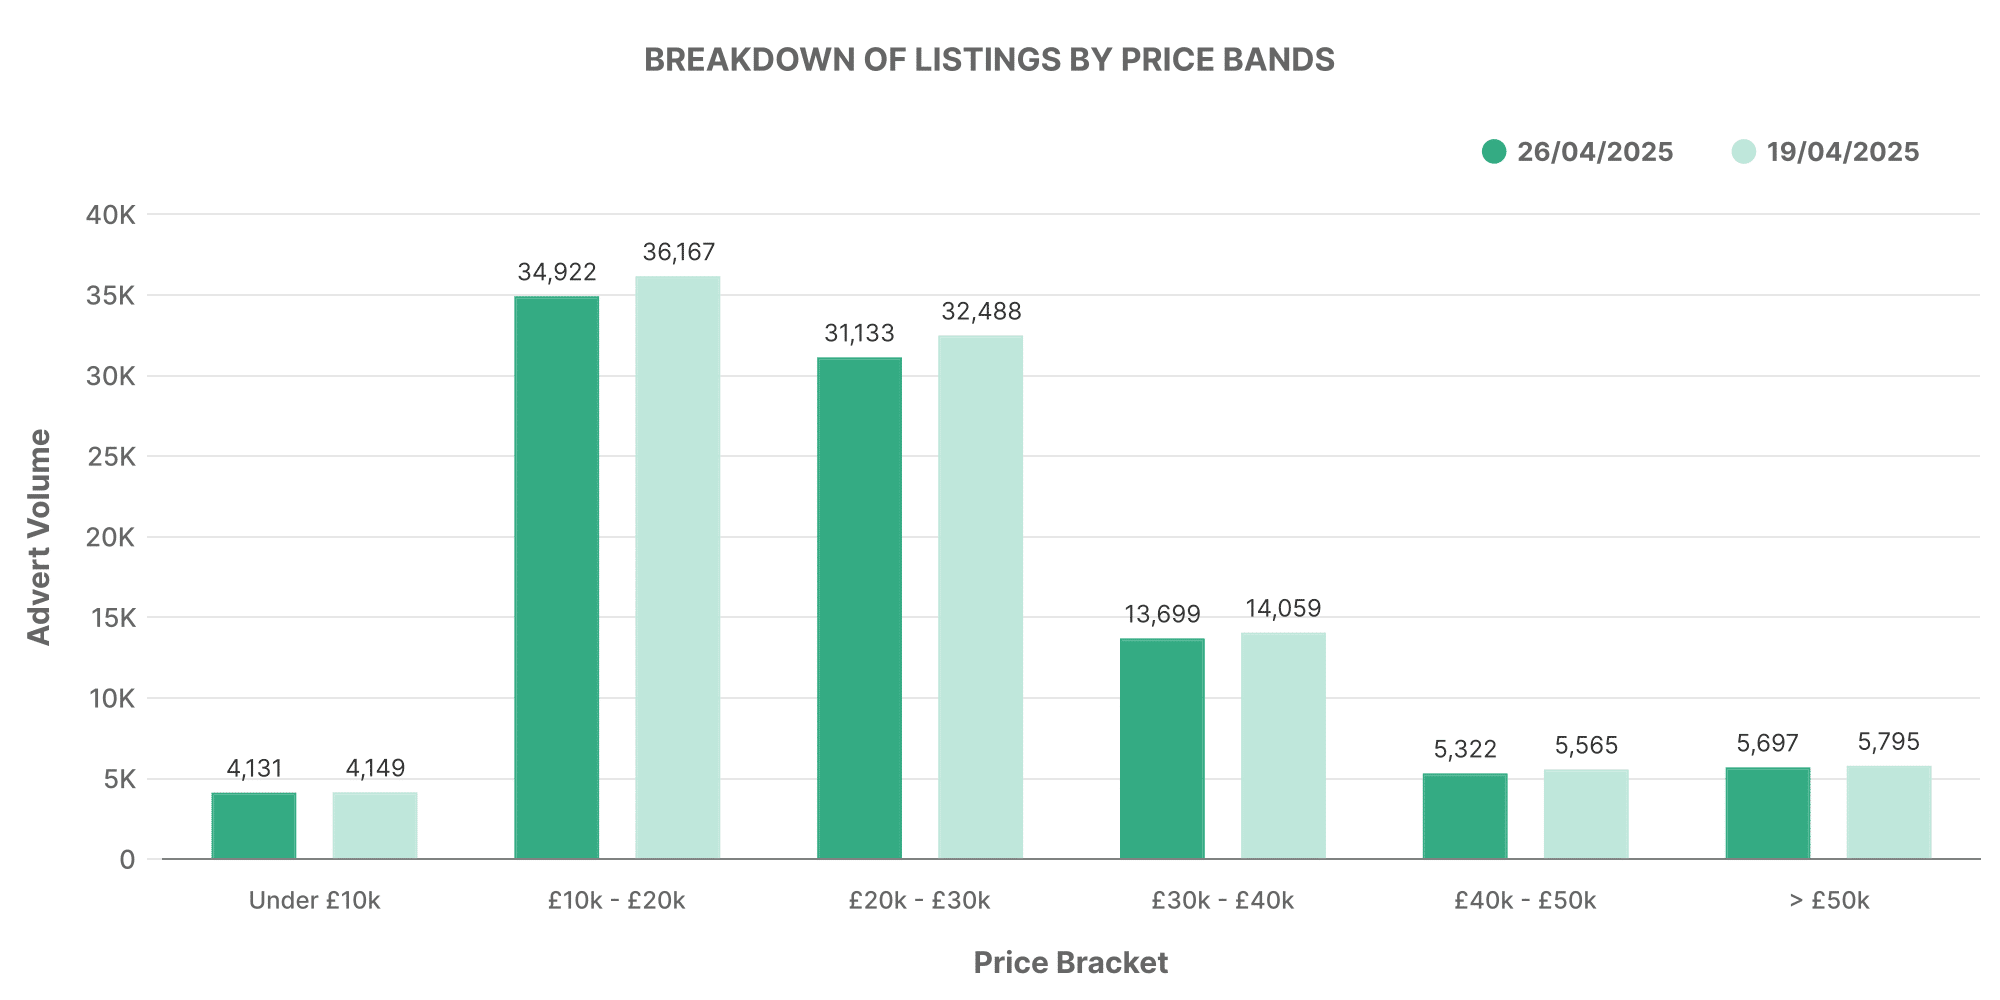
Dealership volume for EVs, as shown in the graph below, tells a different tale from the ICE market.
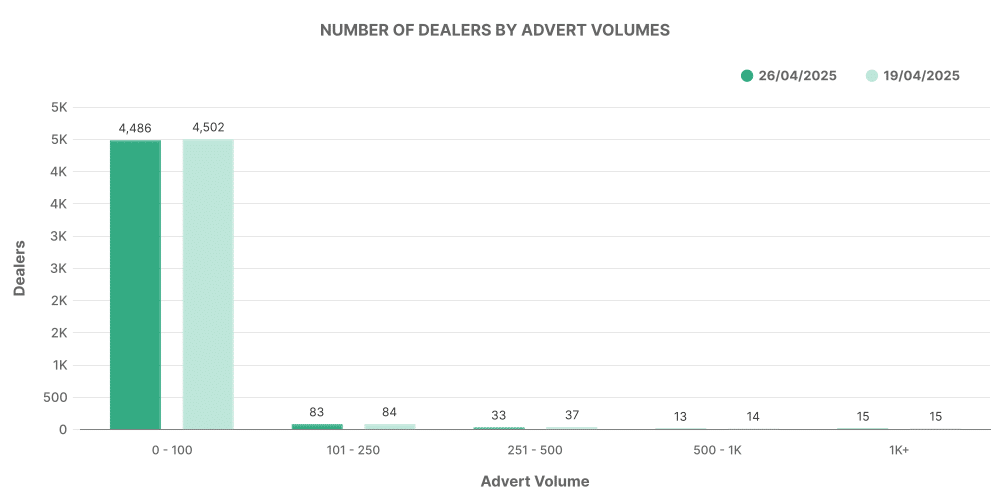
Top 100 dealers in the EV market covered 15% of total listings with vehicles with an above-average market price.
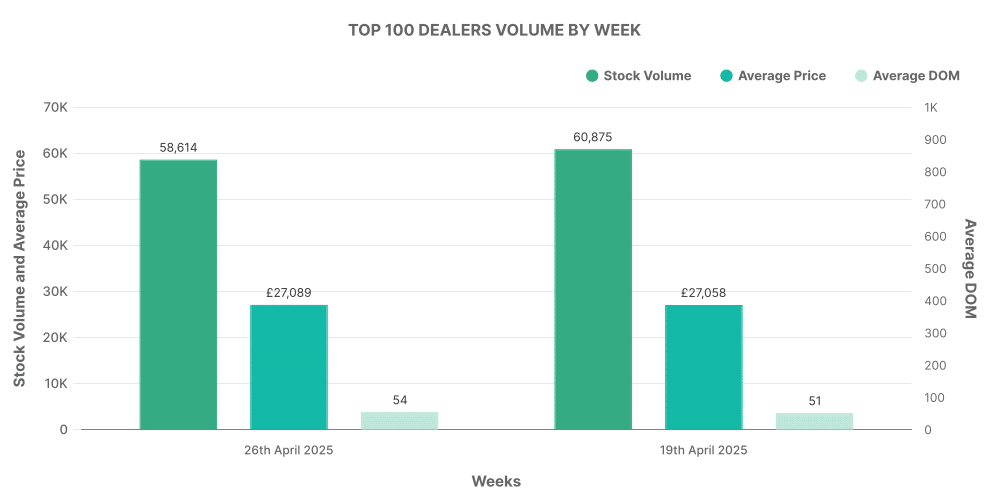
Comparison: ICE vs EV
In comparison, the notable disparity in dealership volumes between ICE and EV listings indicates the earlier stages of EV adaptation by dealerships. The higher average price of EVs reflects the technology’s newer nature, and the significant share that the ‘Top 100’ dealers holds in the EV market is indicative of a less spread market than the ICE market.
EV’s constituted around 16% of the total used car market, reflecting a growing acceptance for EV’s in the UK. However, the demand for ICE vehicles remains strong with an 84% share of the market.
