
UK Weekly Used Car Market Data – October 19, 2024
Navigating current and historical trends within the used car market is a top priority for automotive dealers. Keen insights into these trends can optimise strategic planning, aiming for accelerated growth and efficient financial decisions. This weekly report focuses on the UK used car market, with a special emphasis on the trends and shifts witnessed among Internal Combustion Engine Vehicles (ICE) and Electric Vehicles (EV). By diving deep into this data, insights and direction can be gained for businesses and stakeholders involved in the UK’s automotive sector.
A Closer Look at the ICE Market
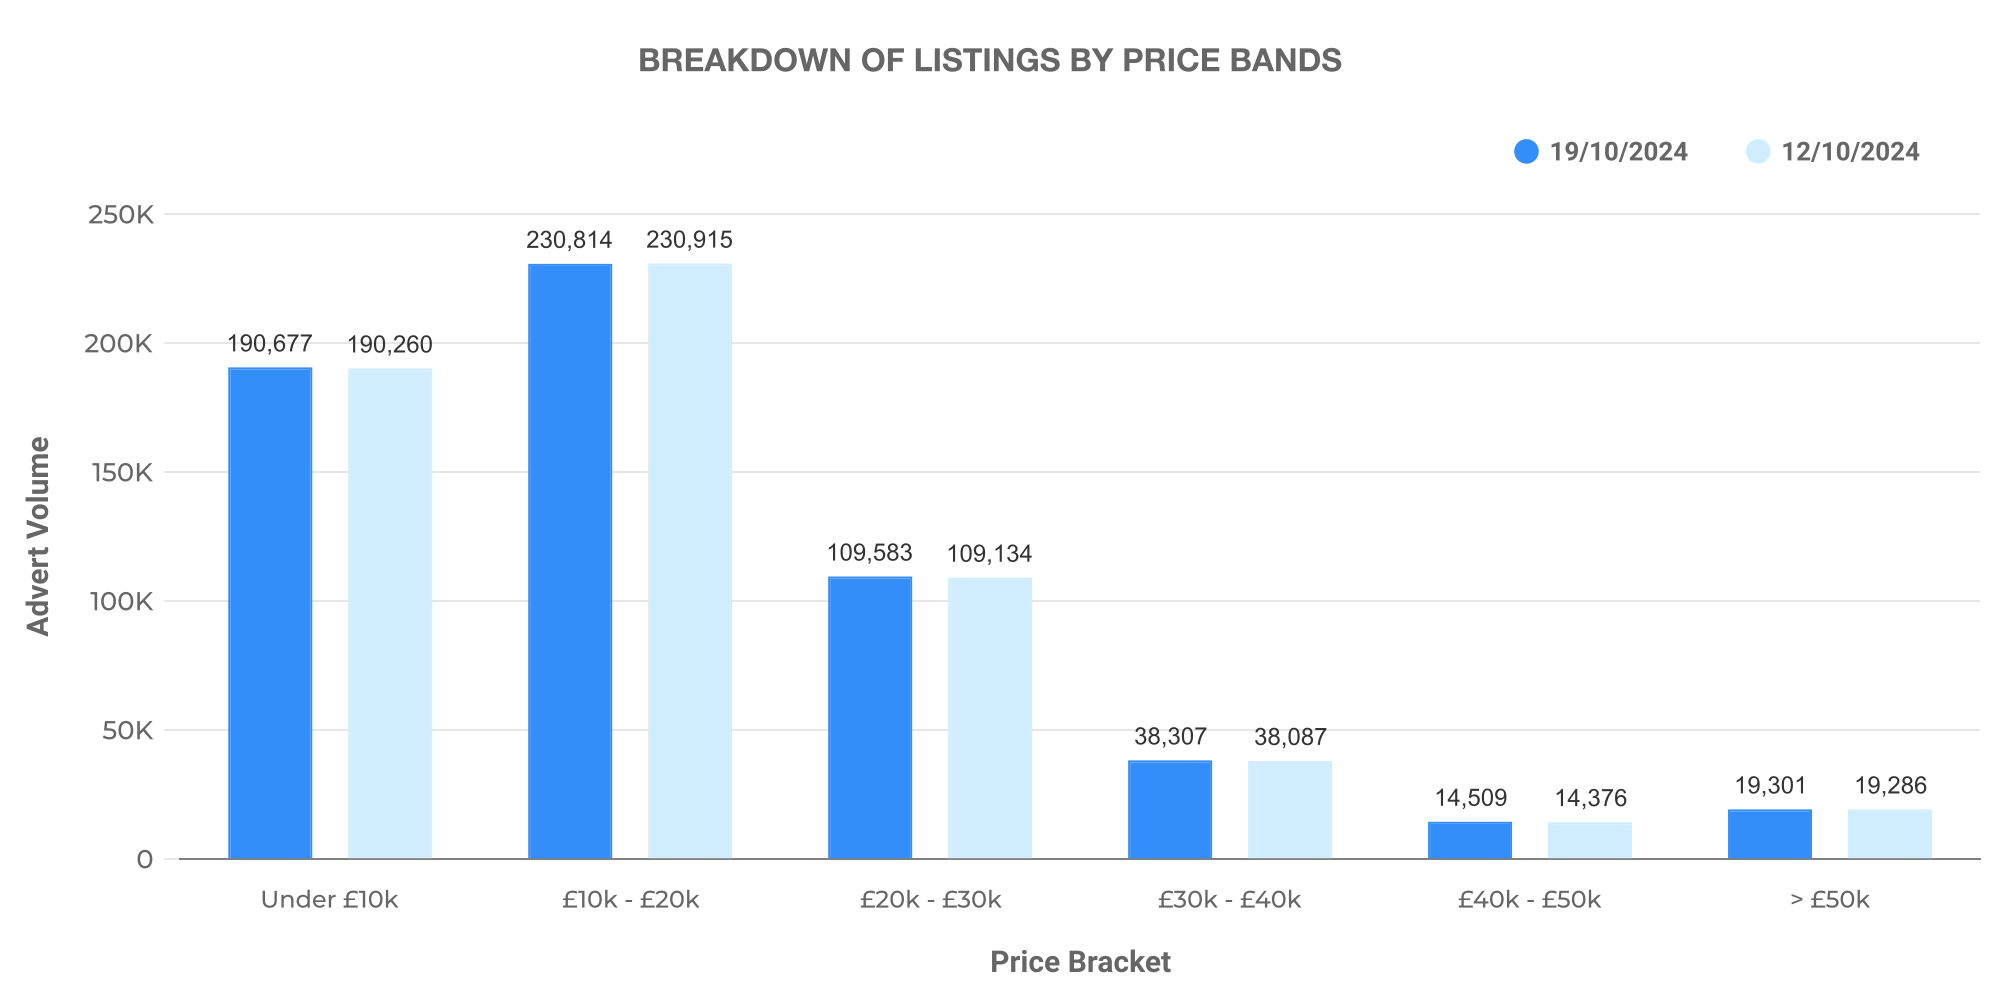
When analysing the data for the ICE vehicles, a great place to start is the volume of listings, average prices, and the distribution of pricing. In the week ending on the 19th of October 2024, a total of 616,444 used ICE cars were listed by 10,644 dealers.
The majority of these ICE vehicle listings fell within the £10,000 – £20,000 price bracket, followed by the £20,000 – £30,000 range. The average asking price for an ICE vehicle in this week was £18,303.
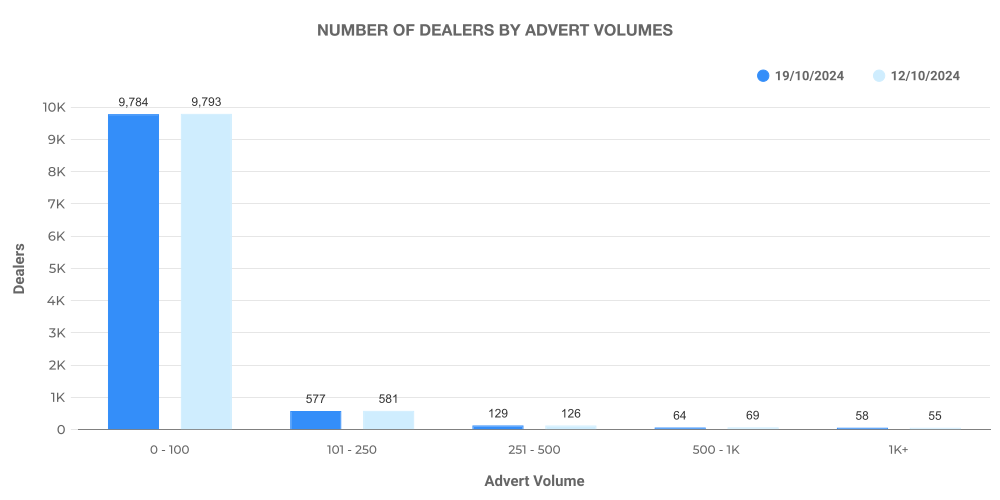
From the dealer’s perspective, most dealers listed between 101-250 vehicles, indicating a healthy and well-established sector.
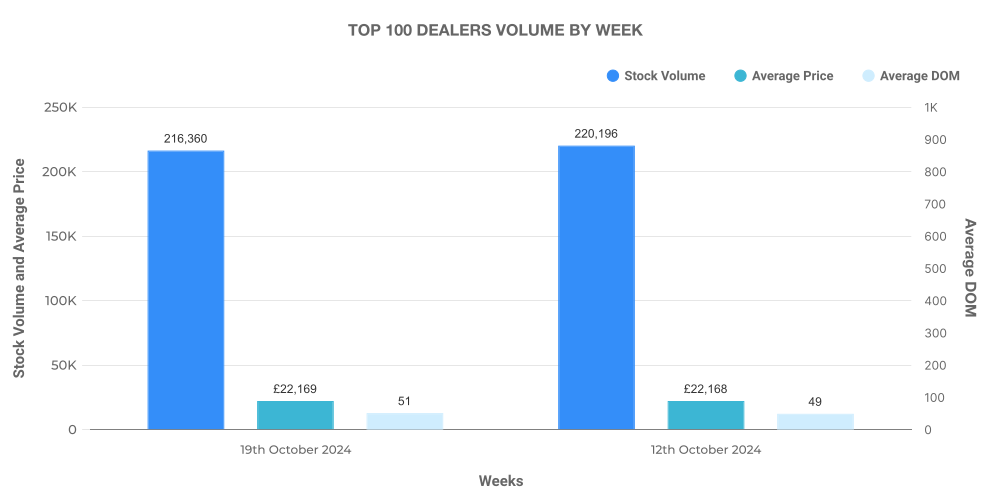
The top 100 dealers accounted for 35% of the total listings, staying ahead of the market average price which reaffirms their stronghold within the ICE market.
Electric Fuelling the Used Car Market
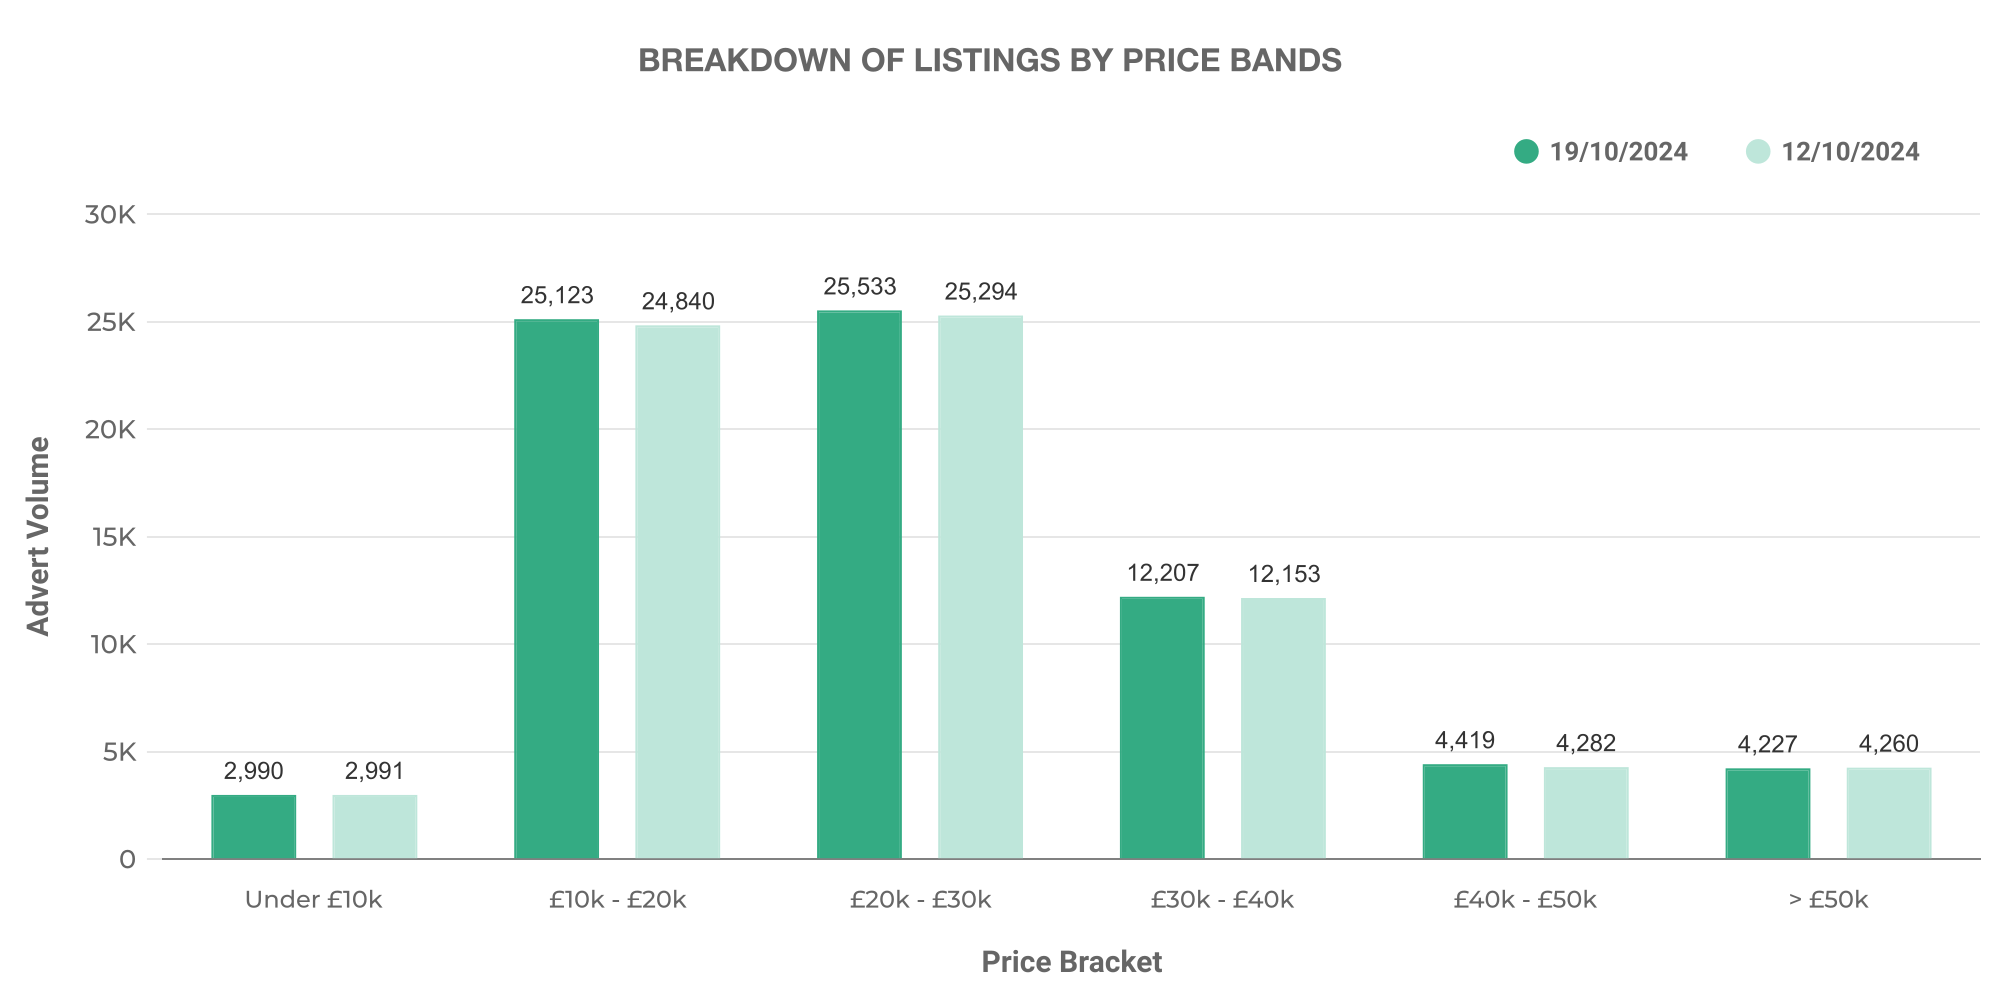
Shifting gears to the electric used car market, a total of 75,608 used EVs were listed by 4,361 dealers in the week ending 19th October, signifying a clear and evident rise in this sector.
Focussing on the pricing trend, the most listed EVs came from the £10,000 – £20,000 and £20,000 – £30,000 ranges. This distribution shows a growing market with a realm of models to suit each customer’s budget. The average price for EVs this week was £27,091, noticeably higher than their ICE counterparts.
From a dealership volume perspective, most dealers continue to list between 0-100 EVs, which showcases the novelty in this market compared to the well-established ICE vehicle market.
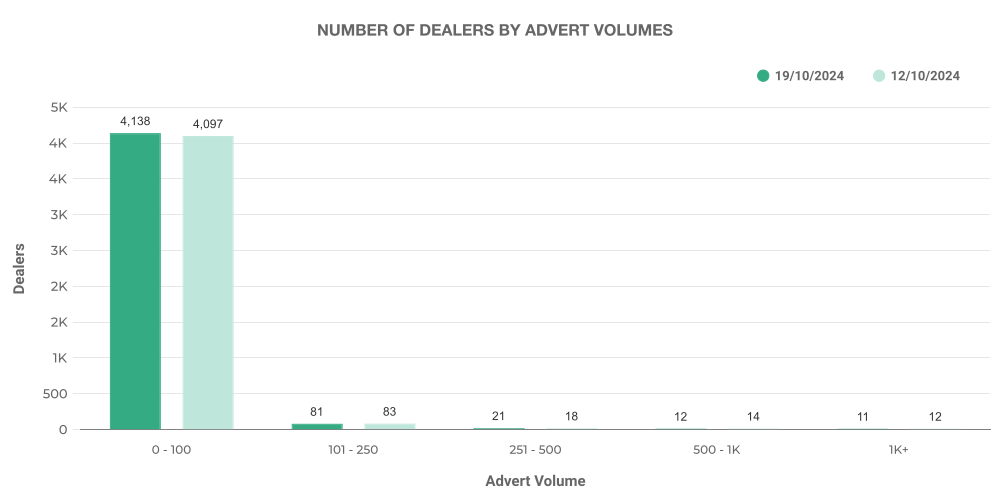
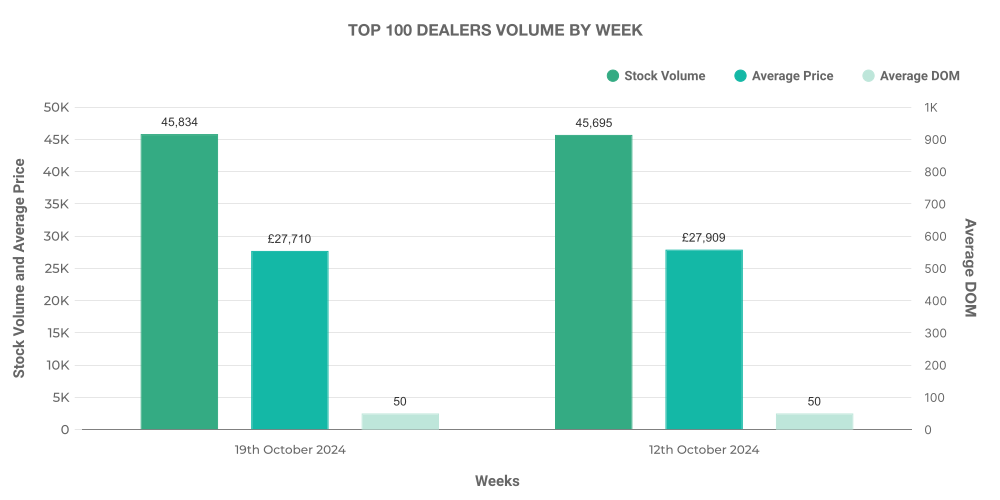
The top 100 dealers in the EV market held 16% of total listings, with their average price slightly ahead of the market average, a testament to the quality offerings.
Insightful Comparison: ICE vs EV
The comparison between ICE and EV reveals the dynamic at play within the used car market. EVs made up 12.27% of all listings in the second week of October, while ICE vehicles accounted for the remaining listings. The EV market undeniably is gaining more traction and has seen a steady rise within the industry.
The high number of Toyota Yaris and Toyota C-HR listings led the way among EVs. Their offerings are likely contributing to the growing popularity of EVs, offering reliable and efficient electric vehicles that are increasingly appealing to conscientious buyers.
Next week: 26th October | Previous week: 12th October