This report provides an in-depth analysis of the used car market data for the week ending 1st June 2024, focusing on both internal combustion engine (ICE) vehicles and electric vehicles (EVs).
Used Car Market Overview
The used car market remains robust, with a large number of listings and dealers actively participating. For the week ending 1st June 2024, the data reveals key metrics and trends that can help dealers make informed decisions about their inventory and pricing strategies.
Total Listings and Dealer Participation
For ICE vehicles, there were 836,351 total listings, supported by 10,513 dealers across 14,229 rooftops. This represents a slight decrease from the previous week, which had 888,088 listings. The average days on market (DOM) for these listings was 84 days, a small increase from the previous week’s 82 days. The average price remained stable at £18,071.
In the EV segment, the total listings were 118,831, a decrease from 130,715 the previous week. There were 4,319 dealers involved in this market, across 7,419 rooftops. The average DOM for EVs was 71 days, a slight increase from 69 days in the previous week. The average price for EVs stood at £27,563.
Breakdown of Listings by Price Bands
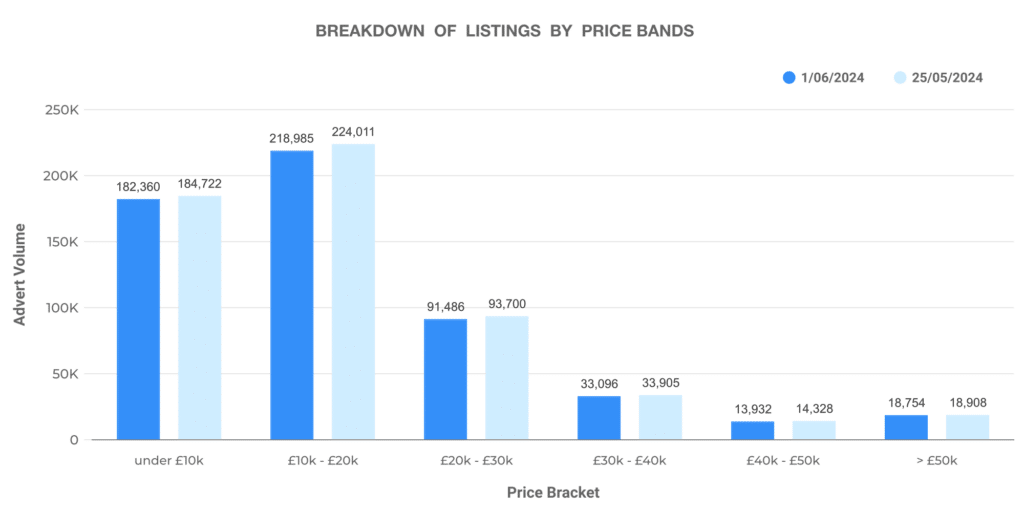
The used car market shows a diverse range of vehicles across various price bands. For ICE vehicles, the distribution is as follows:
- £0-10K: 182,360 listings
- £10-20K: 218,985 listings
- £20-30K: 91,486 listings
- £30-40K: 33,096 listings
- £40-50K: 13,932 listings
- £50K+: 18,754 listings
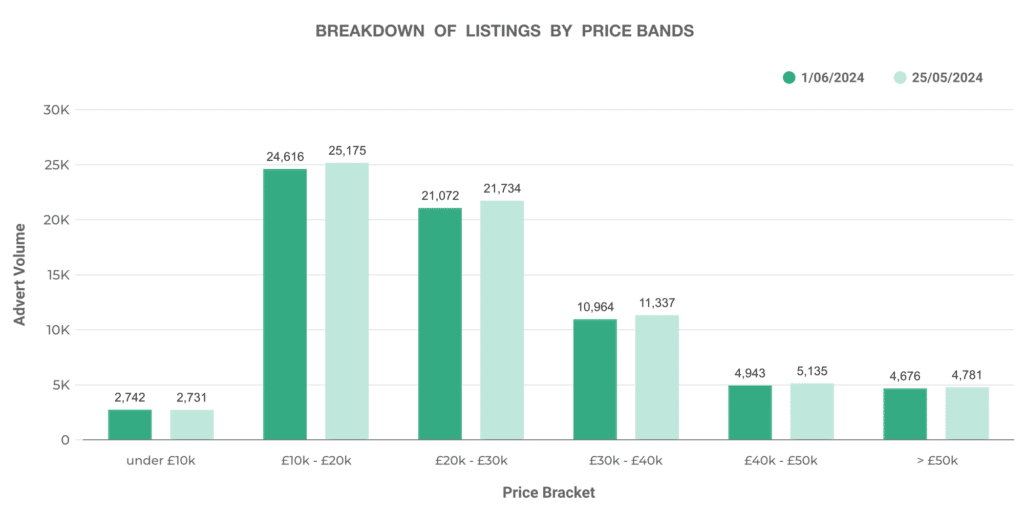
For EVs, the price band distribution is:
- £0-10K: 2,742 listings
- £10-20K: 24,616 listings
- £20-30K: 21,072 listings
- £30-40K: 10,964 listings
- £40-50K: 4,943 listings
- £50K+: 4,676 listings
Number of Dealers by Advert Volumes
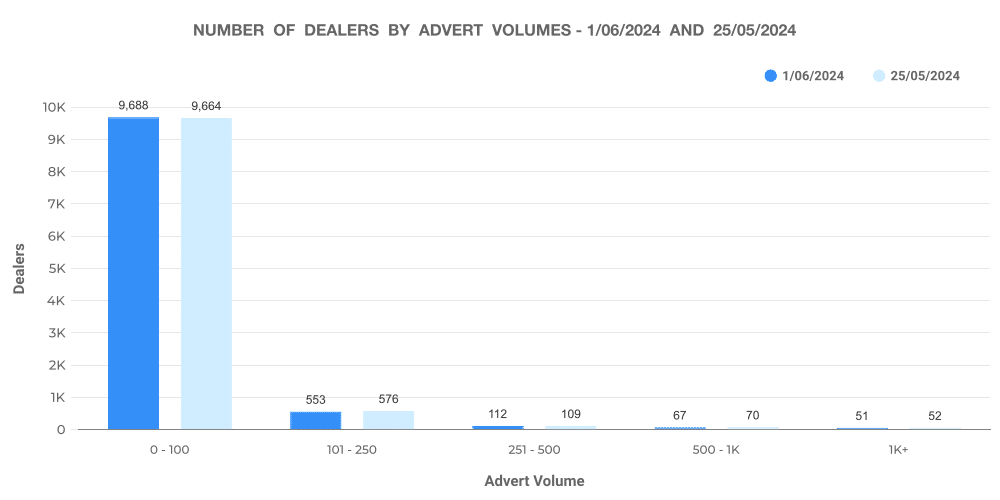
Dealers in the UK used car market vary widely in the volume of advertisements they manage. For ICE vehicles, the distribution of dealers by inventory volume is:
- 0-100 vehicles: 9,688 dealers
- 101-250 vehicles: 553 dealers
- 251-500 vehicles: 112 dealers
- 500-1K vehicles: 67 dealers
- 1K+ vehicles: 51 dealers
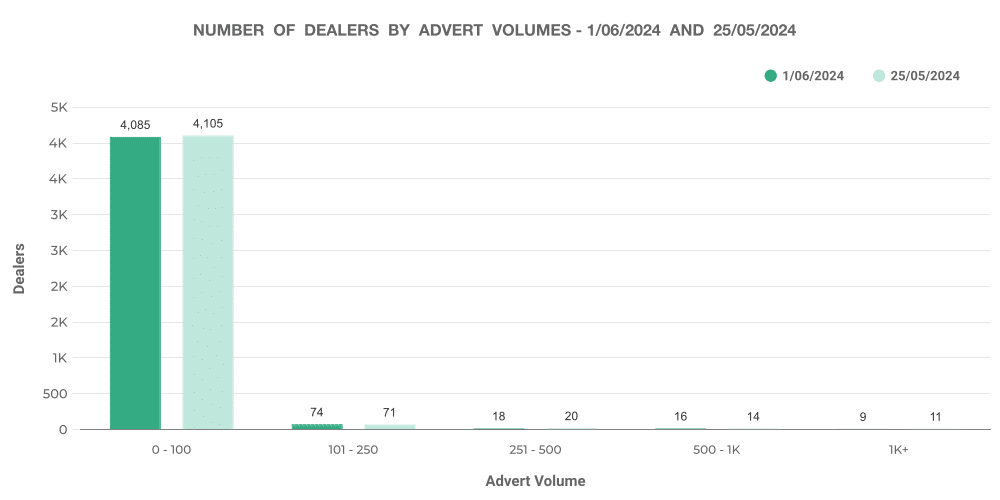
For EVs, the distribution is:
- 0-100 vehicles: 4,085 dealers
- 101-250 vehicles: 74 dealers
- 251-500 vehicles: 18 dealers
- 500-1K vehicles: 16 dealers
- 1K+ vehicles: 9 dealers
Analysis of Top 100 Dealers by Volume
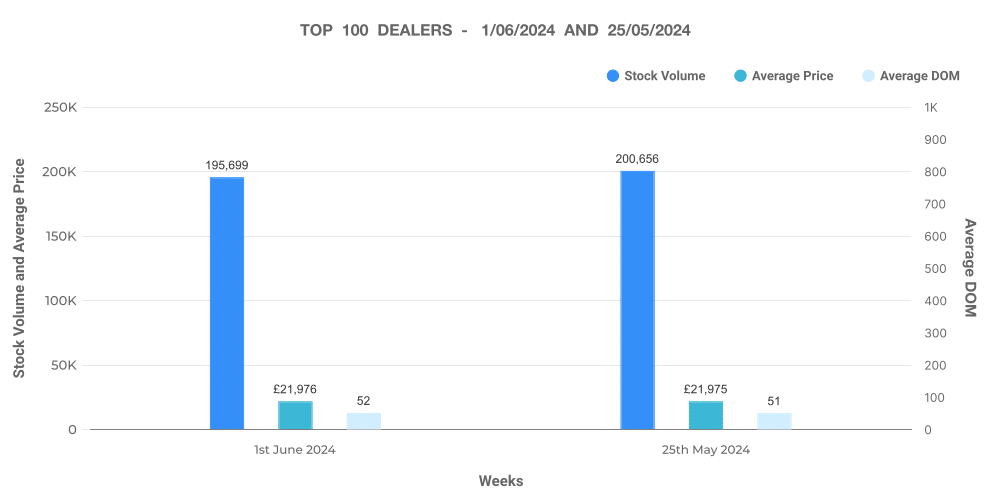
Examining the top 100 dealers by volume provides insight into high-performing dealers in the market. For ICE vehicles, the top 100 dealers had an average stock volume of 195,699, with an average DOM of 52 days and an average price of £21,976. These dealers saw 12,509 price increases and 57,816 price decreases.
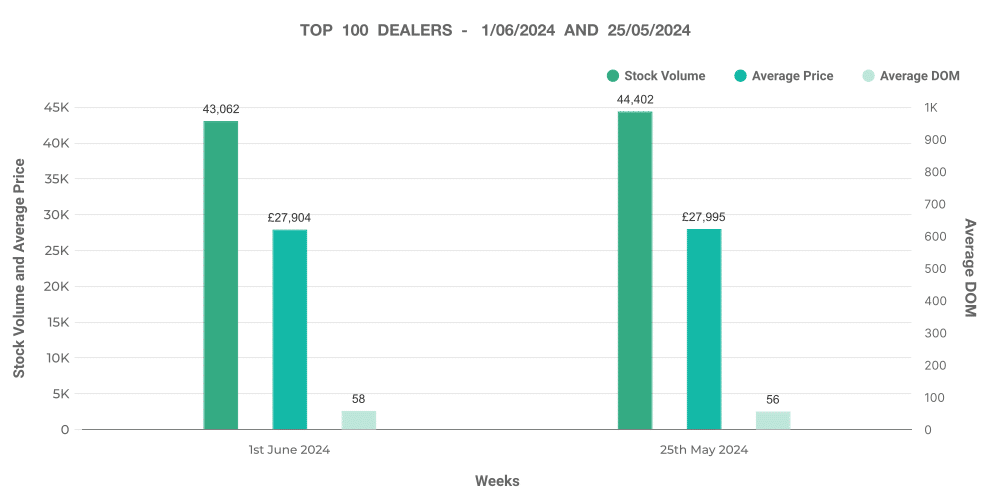
For EVs, the top 100 dealers had an average stock volume of 43,062, with an average DOM of 58 days and an average price of £27,904. There were 2,005 price increases and 13,002 price decreases among these top dealers.
ICE vs EV Market Comparison
The EV market, although smaller than the ICE market, shows unique trends and potential growth areas. The percentage share of EVs in the overall UK used car market is 12.39%, with ICE vehicles making up 87.61%. The average price of EVs is notably higher at £27,563 compared to £16,733 for ICE vehicles.
Price Trends
EVs command a higher average price, reflecting their newer technology and growing demand. This trend indicates that dealerships might need to adjust their inventory and pricing strategies to cater to the increasing interest in EVs. The data suggests a stable market for both ICE and EVs, with minor fluctuations in average prices and DOM.
Inventory Management
Effective inventory management is crucial for maximising sales and profitability. The data shows that a majority of dealers manage smaller inventories, especially in the EV segment. This could indicate a cautious approach towards stocking EVs, possibly due to their higher price points and evolving market demand.
How Marketcheck UK Can Help
Marketcheck UK offers extensive data on used car listings, including both ICE and EV markets. Our tools and services, such as CSV feeds, APIs, and analysis tools, provide dealers with the data they need to make informed decisions. Whether you are looking to adjust your pricing strategy, manage your inventory more effectively, or understand market trends, Marketcheck UK has the solutions you need. Contact us today to learn more about how we can support your business in navigating the dynamic used car market.
