
Providing in-depth analysis of the UK used car market data for the week ending 27th July 2024, this report focuses on both internal combustion engine (ICE) vehicles and electric vehicles (EVs). We will break down the data, highlight key trends, and explore how Marketcheck UK’s comprehensive data solutions can help dealers stay ahead in this competitive market.
Overview of the Used Car Market
ICE Vehicles
The total number of dealers handling ICE vehicles slightly decreased from 10,786 to 10,753, with the total listings increasing from 852,581 to 902,665. This indicates a robust market with a substantial volume of used cars available for potential buyers. The average days on market (DOM) remained stable at 84 days, reflecting a steady demand and turnover rate.
Breakdown of Listings by Price Bands
- £0-10K: Increased from 187,132 to 192,601 listings.
- £10-20K: Increased from 216,823 to 223,718 listings.
- £20-30K: Increased from 96,165 to 98,529 listings.
- £30-40K: Increased from 34,584 to 35,035 listings.
- £40-50K: Slightly increased from 14,162 to 14,200 listings.
- £50K+: Increased from 18,868 to 18,944 listings.
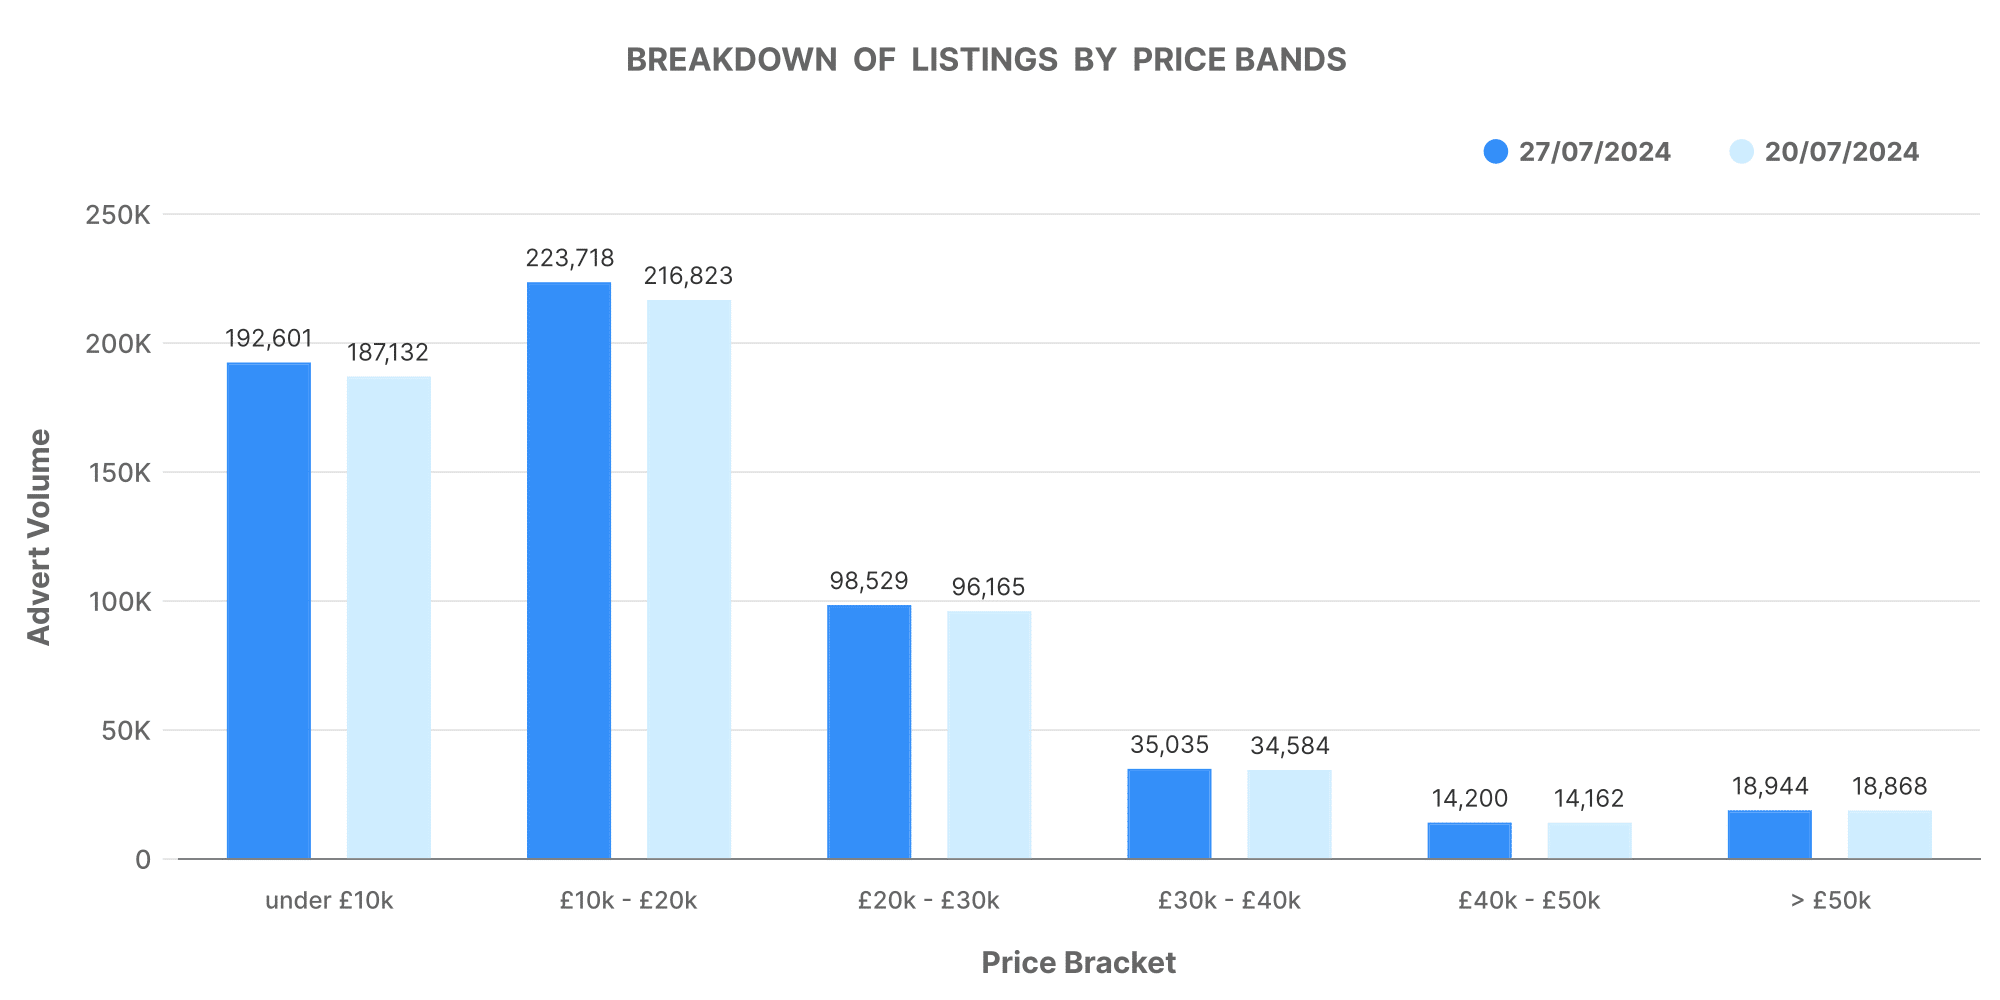
This rise across all price bands suggests a growing market with more varied price points, allowing dealers to cater to a broader range of customers.
Number of Dealers by Advert Volumes
- 0-100 Listings: Increased from 9,948 to 9,892 dealers.
- 101-250 Listings: Increased from 547 to 587 dealers.
- 251-500 Listings: Increased from 121 to 117 dealers.
- 500-1K Listings: Increased from 64 to 66 dealers.
- 1K+ Listings: Increased from 50 to 51 dealers.
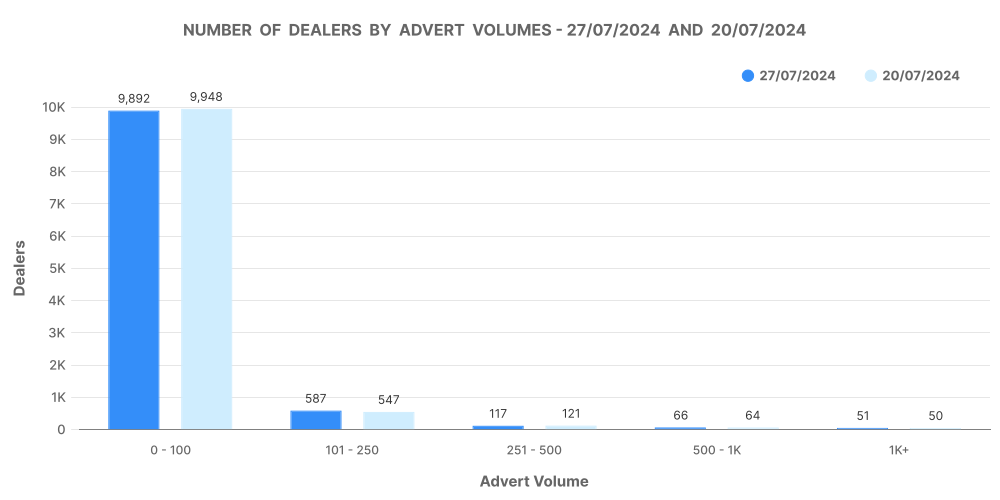
The majority of dealers maintain a smaller inventory, with significant activity seen in the lower volume bands. However, there is a noticeable increase in dealers managing larger inventories, which could indicate a trend towards consolidation or larger dealerships expanding their stock.
Analysis of Top 100 Dealers by Volume
- Stock Volume: Increased from 195,978 to 201,874.
- Average DOM: Slightly decreased from 52 to 51 days.
- Average Price: Decreased from £22,116 to £22,043.
- Price Increases: Increased from 13,259 to 15,693.
- Price Decreases: Increased from 62,908 to 71,829.

The top 100 dealers show a healthy turnover with a slight reduction in DOM, suggesting efficient sales strategies. The mixed movement in price adjustments indicates dynamic pricing strategies in response to market conditions.
EV Vehicles
The electric vehicle market continues to grow, reflecting broader trends in the automotive industry towards greener alternatives. The total number of dealers handling EVs increased from 4,390 to 4,412, with total listings rising from 123,504 to 133,551. The average DOM for EVs decreased from 70 to 69 days, showing an increase in demand and quicker sales.
Breakdown of Listings by Price Bands
- £0-10K: Increased from 3,163 to 3,293 listings.
- £10-20K: Increased from 24,239 to 25,319 listings.
- £20-30K: Increased from 22,278 to 22,986 listings.
- £30-40K: Increased from 11,491 to 11,627 listings.
- £40-50K: Slightly decreased from 4,850 to 4,822 listings.
- £50K+: Slightly decreased from 4,706 to 4,669 listings.

The increase in listings across most price bands, particularly in the more affordable segments, indicates a growing availability and possibly higher turnover of lower-priced EVs.
Number of Dealers by Advert Volumes
- 0-100 Listings: Increased from 4,706 to 4,669 dealers.
- 101-250 Listings: Increased from 21 to 25 dealers.
- 251-500 Listings: Increased from 13 to 12 dealers.
- 500-1K Listings: Increased from 9 to 10 dealers.
- 1K+ Listings: Remained stable at 10 dealers.

Similar to ICE vehicles, the majority of EV dealers maintain a smaller inventory, though there is a slight increase in dealers with larger volumes, indicating market expansion.
Analysis of Top 100 Dealers by Volume
- Stock Volume: Increased from 42,955 to 44,138.
- Average DOM: Remained stable at 56 days.
- Average Price: Decreased from £28,125 to £27,791.
- Price Increases: Increased from 2,628 to 3,300.
- Price Decreases: Increased from 14,269 to 16,806.

The top 100 EV dealers show stability in sales velocity with slight price adjustments, reflecting a responsive market strategy.
EV vs ICE Market Comparison
The percentage share of EVs in the used car market in the UK remains at 12.39%, with ICE vehicles dominating at 87.61%. The average price of EVs is significantly higher at £27,334 compared to £16,721 for ICE vehicles. This price difference highlights the premium associated with electric cars, likely due to newer technology and higher initial production costs.
Market Insights
- EV Growth: The increasing number of EV listings and the stable DOM suggest a healthy and growing demand for electric cars.
- Price Trends: The higher average price of EVs indicates a market willing to invest in newer technology, despite the premium.
- Dealer Strategies: Dealers with larger inventories are increasing, suggesting a trend towards market consolidation and the benefits of larger stock holdings.
How Marketcheck UK Can Help
Marketcheck UK offers a range of tools to help dealers navigate this complex market. By providing comprehensive data on every current and historical used car advert listing in the UK, dealers can gain valuable insights into market trends, pricing strategies, and inventory management.
Benefits of Marketcheck UK Data
- Real-Time Market Insights: Access to up-to-date data helps dealers make informed decisions on pricing and stock management.
- Competitive Analysis: Understand how your dealership compares with others in terms of inventory, pricing, and sales strategies.
- Optimised Inventory Management: Adjust stock levels based on demand and market trends to maximise sales and profitability.
- Detailed Reports: Generate reports to track performance and identify opportunities for growth.
Next week: 3rd August | Previous week: 20th July