
Covering the week ending 3rd August 2024, this data provides valuable insights into both the internal combustion engine (ICE) and electric vehicle (EV) segments of the used car market. Understanding these trends not only helps in making informed decisions but also positions dealers to better meet consumer demand.
Overview of the UK Used Car Market
The UK used car market continues to be a dynamic environment, with thousands of dealers vying for the attention of discerning buyers. During the week ending 3rd August 2024, a total of 10,716 dealers were active across 14,620 rooftops, offering 926,429 listings. These figures indicate a stable market presence, with only a slight variation in dealer activity compared to the previous week.
The average number of days a car spends on the market (days on market or DOM) has decreased to 83 days from 84 days in the previous week. This slight reduction suggests that vehicles are selling marginally faster, potentially due to seasonal demand shifts or effective pricing adjustments. The average price for used cars has seen a modest increase to £18,147, up from £18,045 the week before, indicating a stable pricing environment with a slight upward trend.
Breakdown of Listings by Price Bands (ICE)
The distribution of car listings across different price bands remains relatively balanced. The majority of cars are listed within the £10,000 to £20,000 price range, with 226,905 vehicles, up slightly from the previous week’s 223,718 vehicles. This is followed by the £20,000 to £30,000 range, which also saw an increase to 100,933 listings from 98,529. These bands indicate where the bulk of market activity is concentrated, with higher-priced vehicles (£50,000+) remaining a smaller segment of the market at 14,367 listings.

This data highlights the affordability sweet spot for a used car, where the majority of transactions occur. For dealers, this is an important insight when considering the stock to acquire or sell. The marginal increase in higher price band listings might suggest a growing interest in more premium vehicles, though the core market remains centred around more affordable options.
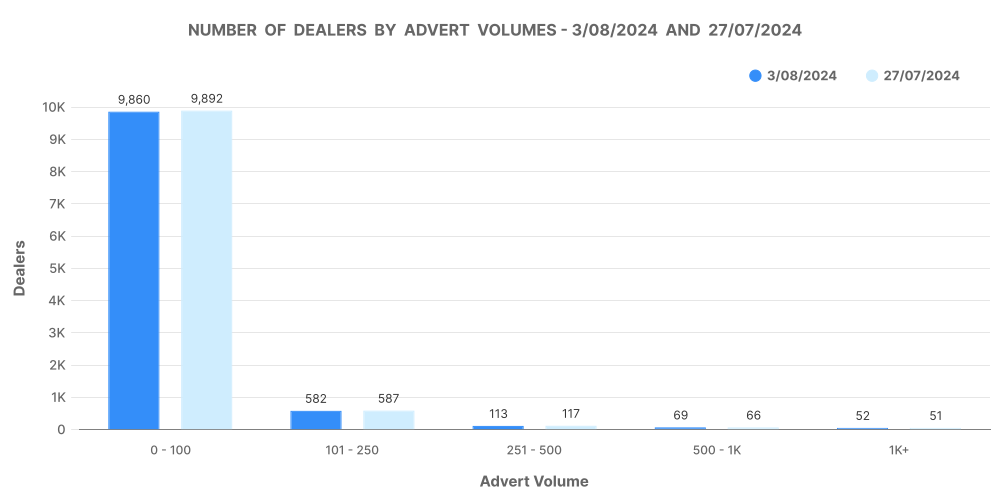
Number of Dealers by Advert Volumes
Dealers with smaller inventories (0-100 cars) dominate the market, with 19,365 dealers in this category. However, there’s notable activity among dealers with larger inventories, with 582 dealers listing between 101-250 cars, and 113 dealers listing between 251-500 cars. This spread reflects the diversity in dealership sizes and strategies, where both niche and volume-based operations play significant roles.
For dealers looking to expand or adjust their inventory, understanding where the bulk of the competition lies can be crucial. Smaller dealers might benefit from focusing on niche markets or unique selling points, while larger dealers could leverage their extensive inventories to offer competitive pricing or bundle deals.
Electric Vehicle Market Insights
The electric vehicle (EV) market continues to carve out its space in the used car sector, with data from the week ending 3rd August 2024 highlighting key trends. A total of 4,408 dealers were active in the EV market, spread across 7,668 rooftops, offering 135,631 listings. These figures represent a stable market presence, with a slight increase in listings compared to the previous week.
Analysis of EV Listings and Price Bands
The average days on market for EVs decreased slightly to 68 days, down from 69 days the previous week, indicating a slightly quicker turnover compared to the overall used car market. The average price of an EV remains significantly higher than that of ICE vehicles, standing at £27,416, a small increase from £27,334.
EV listings are also spread across various price bands, with the majority of vehicles priced between £20,000 and £30,000 (25,668 listings), followed closely by the £30,000 to £40,000 band with 23,291 listings. The higher price bands (£50,000+) contain fewer listings but are still a significant part of the market at 4,908 listings.

For dealers, the relatively high average price of EVs reflects both the technology premium and the growing demand for these vehicles. As more consumers look to transition to electric, understanding these price dynamics is essential for effective inventory management and pricing strategies.
Number of EV Dealers by Advert Volumes
Similar to the ICE market, the majority of EV dealers operate with smaller inventories. There are 4,687 dealers with 0-100 cars, while only 24 dealers have inventories between 101-250 cars. The smaller number of dealers with large inventories might indicate a more cautious approach to stocking EVs, likely due to the higher upfront costs and evolving market demand.

However, for dealers who have embraced larger EV inventories, there’s a potential for higher returns, especially as the market matures and consumer acceptance grows. These insights can guide dealers in making strategic decisions about whether to increase their EV inventory or focus on specific price bands where demand is strongest.

ICE vs. EV: A Comparative Analysis
Comparing the ICE and EV segments offers valuable insights into the broader trends shaping the UK automotive market. As of the week ending 3rd August 2024, EVs accounted for 12.39% of the total used car listings, a figure unchanged from the previous week. This indicates that while EVs are gaining traction, ICE vehicles still dominate the market with 87.61% of listings.
The average price of EVs is notably higher at £27,416 compared to £18,147 for ICE vehicles. This significant price difference reflects the premium associated with electric technology, as well as the relatively newer nature of EVs in the used market. However, as more affordable EV models enter the market and the technology becomes more widespread, we might expect this gap to narrow over time.
For dealers, the key takeaway is the importance of balancing their ICE and EV inventory to match consumer demand. While ICE vehicles remain the backbone of the market, the growing share of EVs cannot be ignored. Dealers who position themselves well in both segments stand to benefit from the full spectrum of buyer preferences.
Marketcheck UK’s Role in the Automotive Market
For automotive dealers looking to stay ahead of the curve, Marketcheck UK offers invaluable tools and data-driven insights. By providing comprehensive data on every current and historical used car advert listing in the UK, Marketcheck empowers dealers with the information they need to make strategic decisions.
Whether it’s through CSV feeds, APIs, or website tools, Marketcheck delivers up-to-date data that helps dealers understand market trends, track vehicle performance, and optimise their inventory. This real-time data is crucial for making informed decisions in a competitive market where timing and accuracy are key.
Next week: 10th August | Previous week: 27th July