
The used car market in the UK continues to show steady activity, with noticeable trends emerging in both internal combustion engine (ICE) and electric vehicle (EV) segments. This analysis covers data from the week starting on 3rd August 2024, offering a detailed breakdown of market dynamics, including dealer activity, inventory distribution, and pricing trends. We will explore the significant shifts within the used car market, focusing on how the electric used car market compares to the ICE market.
Overall Used Car Market (ICE) Insights
The data from the past week reveals a stable yet competitive environment in the used car market. The total number of dealers involved slightly decreased, moving from 10,716 to 10,690, while the total number of listings saw a marginal increase from 926,429 to 928,492. The average days on market (DOM) remained consistent at 83 days, indicating a stable market duration for sales turnover.
Breakdown of Listings by Price Bands
When examining the price distribution of listed vehicles, the majority of listings were concentrated in the £10K-£20K price band, accounting for 225,801 listings, followed by the £20K-£30K range with 101,120 listings. Higher-end vehicles in the £50K+ category made up the smallest segment, with 14,247 listings. This distribution suggests that the market remains robust in the mid-range price segment, with a smaller appetite for high-end used vehicles.

Number of Dealers by Advert Volumes
Looking at the distribution of advert volumes across dealers, the majority of dealers (9,836) managed inventories of 0-100 vehicles. Only 578 dealers had inventories in the 251-500 range, and a mere 53 dealers managed 500-1,000 vehicles. This skew towards smaller inventory volumes reflects the market’s fragmentation, with a significant number of small-scale dealers operating within the market.

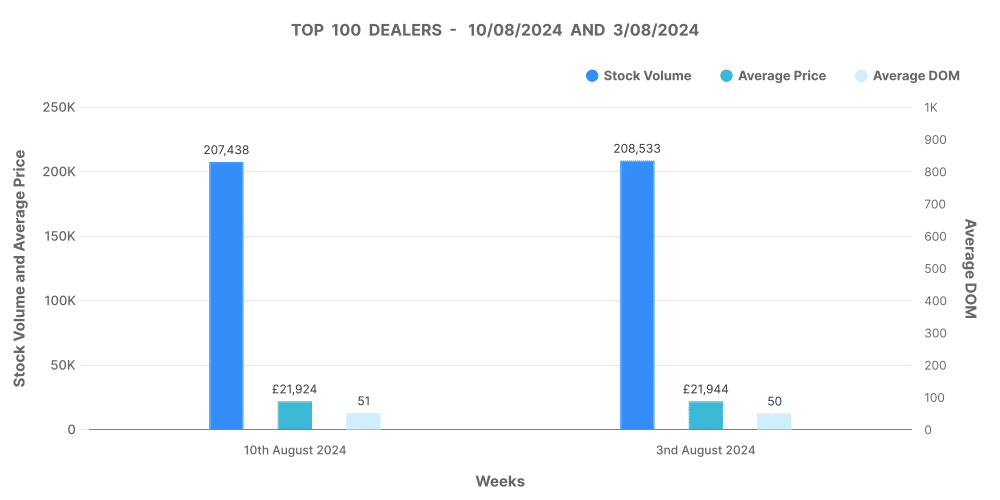
Analysis of Top 100 Dealers by Volume
The top 100 dealers, who are typically market leaders, had a slight decline in stock volume from 208,533 to 207,438. Despite this reduction, their average DOM increased by 1 day, indicating a slightly slower turnover. The average price of vehicles held by these top dealers stood at £21,924, which is above the overall market average, signifying their focus on higher-value vehicles. Interestingly, there was a noticeable increase in the number of price decreases among these top dealers, suggesting aggressive pricing strategies to move inventory.
Electric Used Car Market (EV) Insights
The electric vehicle market segment remains a smaller yet growing portion of the overall used car market. This past week, the number of dealers offering electric vehicles (EVs) slightly decreased to 4,406 from 4,408, with total listings increasing from 135,631 to 138,028. The average DOM for EVs held steady at 68 days, slightly lower than the ICE market, indicating a quicker sales cycle for electric vehicles.
Breakdown of Listings by Price Bands for EVs
For EVs, the price distribution is slightly different compared to the ICE market. The £20K-£30K price band was the most active, with 25,573 listings, followed closely by the £30K-£40K range with 23,412 listings. High-end EVs (£50K+) had a smaller yet significant presence, with 4,830 listings. This spread suggests that while there is a solid demand for mid-range EVs, there remains a niche market for premium electric vehicles.

Number of Dealers by Advert Volumes for EVs
The majority of EV dealers (4,177) are also operating with smaller inventories (0-100 vehicles). Only 77 dealers had inventories between 500-1,000 vehicles, illustrating a similar trend of market fragmentation seen in the broader used car market.

Analysis of Top 100 Dealers by Volume for EVs
Top 100 EV dealers also mirrored trends seen in the overall market, with a slight decrease in stock volume from 44,803 to 44,616 vehicles. The average DOM remained stable at 54 days, but there was an increase in price adjustments, with 3,533 price increases and 564 price decreases. The average price for vehicles held by these top dealers was £27,830, reflecting a focus on higher-value electric vehicles.

Comparing EV and ICE Market Trends
A comparative analysis of the ICE and EV markets reveals some key insights:
- Market Share: EVs currently account for 12.42% of the overall used car market, a slight increase from the previous week, suggesting a gradual growth in this segment. The vast majority of the market, 87.58%, remains dominated by ICE vehicles.
- Pricing Trends: The average price of EVs (£27,335) is notably higher than that of ICE vehicles (£18,097), indicating that EVs remain a premium option within the used car market. This price gap reflects the newer technology and higher production costs associated with electric vehicles.
- Days on Market: EVs have a faster turnover with an average DOM of 68 days, compared to 83 days for ICE vehicles. This suggests a higher demand for EVs or more aggressive pricing and sales strategies within this segment.
Insights for Automotive Dealers
For automotive dealers, understanding these trends is crucial in adapting to market demands. The data suggests that while the ICE market remains dominant, there is a growing opportunity in the EV sector, particularly in the mid-range and high-end price bands. Dealers looking to expand their EV inventory should consider focusing on these segments to capitalise on the quicker turnover and higher average prices.
For those managing ICE vehicles, maintaining a competitive edge through dynamic pricing and inventory management is key, especially in a market where top dealers are increasingly making price adjustments to move stock.
How Marketcheck UK Can Help
Marketcheck UK provides the data-driven insights needed to navigate these market trends effectively. Whether you’re looking to optimise your pricing strategy, manage your inventory more efficiently, or explore opportunities in the growing electric vehicle market, Marketcheck UK offers comprehensive data solutions tailored to your needs.
With tools ranging from detailed CSV feeds to advanced API integrations, Marketcheck UK allows you to stay ahead in a competitive market by providing real-time, accurate, and actionable data. This means you can make informed decisions that boost your sales performance and profitability.
In conclusion, the UK used car market is vibrant and evolving, with significant opportunities emerging in the EV sector. By leveraging Marketcheck UK’s insights and tools, automotive dealers can strategically position themselves to meet market demands, optimise their operations, and ultimately drive business success.
Next week: 17th August | Previous week: 3rd August