Break down the data for the week ending 17th August 2024, offering insights into both internal combustion engine (ICE) and electric vehicle (EV) segments.
Overview of the Used Car Market (ICE)
For the week ending 17th August 2024, the total number of dealers in the ICE market decreased slightly to 10,651 from 10,690 the previous week. This minor reduction is part of a broader trend that reflects ongoing market adjustments. Despite this, the market remains robust with over 909,833 total listings, marking a 2% decrease from the previous week, which suggests a moderate dip in market activity.
The average days on market (DOM) for ICE vehicles increased by one day to 84 days, indicating a slight slowdown in the time it takes to sell vehicles. This could be due to various factors, including market saturation or seasonal variations, which are common in August.
Price Band Analysis
The pricing trends remain stable, with the majority of vehicles listed within the £10,000 to £30,000 price bands. Specifically:
- £0-£10,000: 191,679 vehicles (21% of total listings)
- £10,000-£20,000: 224,024 vehicles (25% of total listings)
- £20,000-£30,000: 100,467 vehicles (11% of total listings)
- £30,000-£40,000: 35,178 vehicles (4% of total listings)
- £40,000-£50,000: 14,108 vehicles (2% of total listings)
- £50,000+: 18,913 vehicles (2% of total listings)
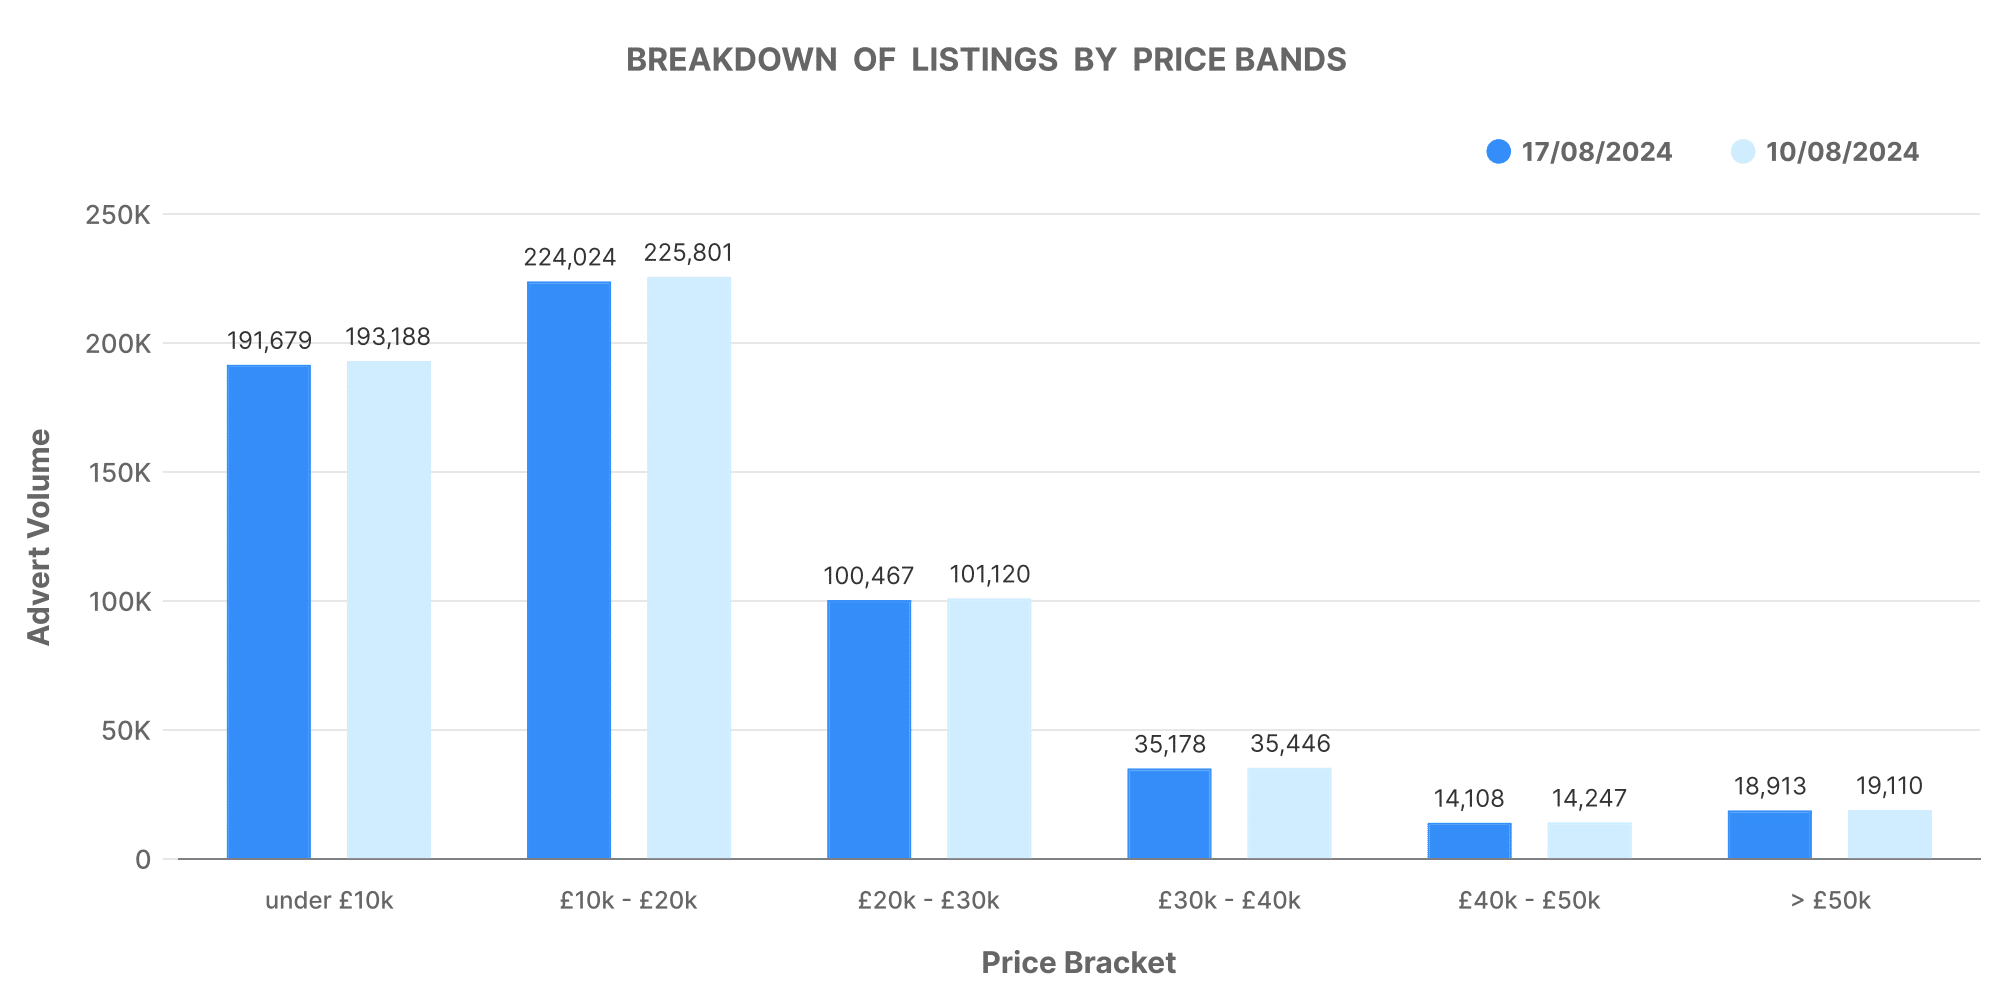
These figures suggest that mid-range vehicles (£10,000-£30,000) continue to dominate the market, reflecting ongoing consumer demand for affordable and reliable options.
Dealer Inventory and Volume Distribution
When we look at dealer inventory:
- 0-100 vehicles: 9,805 dealerships
- 101-250 vehicles: 565 dealerships
- 251-500 vehicles: 119 dealerships
- 500-1,000 vehicles: 67 dealerships
- 1,000+ vehicles: 51 dealerships
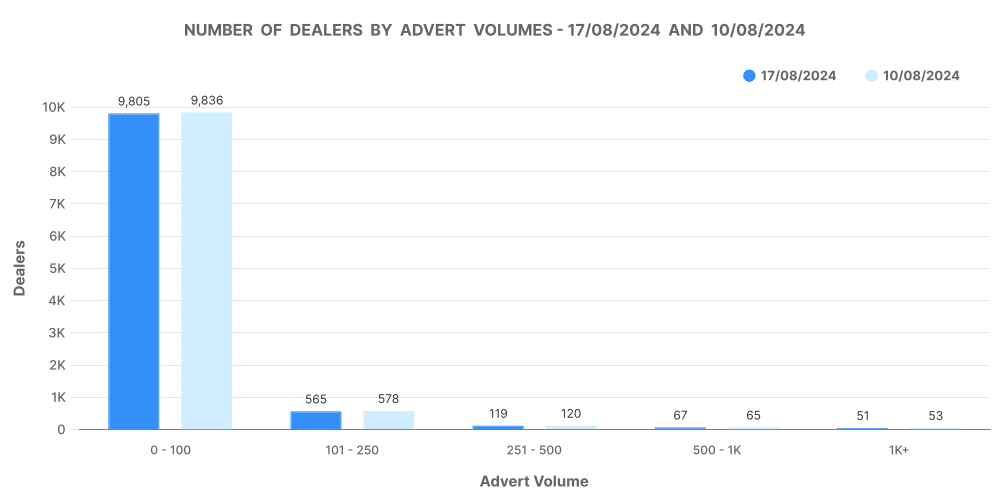
A significant number of dealers operate with smaller inventories (0-100 vehicles), indicating a fragmented market where small to medium-sized enterprises (SMEs) play a key role.
Top 100 Dealers Analysis
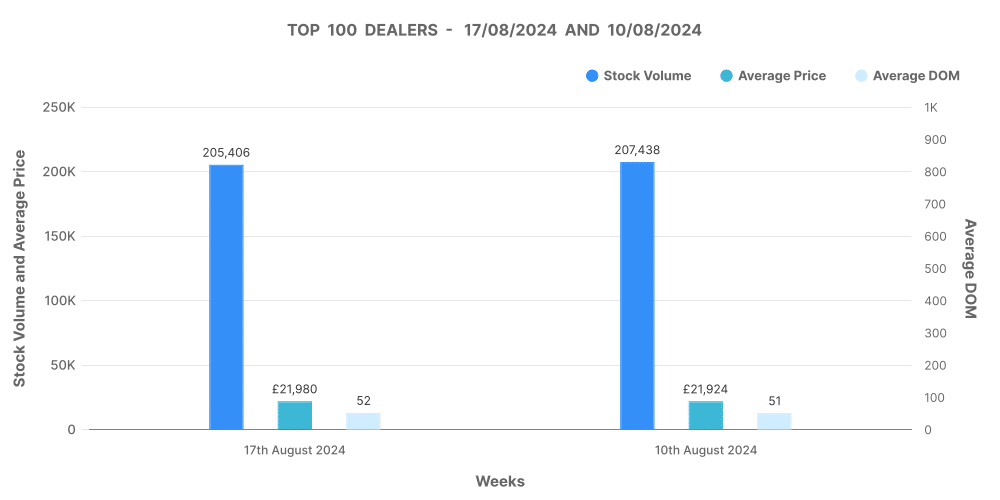
The top 100 dealers, who play a pivotal role in the market, reported a slight dip in stock volumes to 205,406 vehicles. Their average DOM stands at 52 days—significantly shorter than the overall market—highlighting their efficiency in moving inventory. The average price within this segment is £21,980, slightly above the market average, indicating a focus on higher-value vehicles.
Electric Vehicle (EV) Market Insights
The EV segment continues to be a critical area of interest as the automotive industry shifts towards sustainability. For the week ending 17th August 2024, the total number of dealers in the EV market was 4,387, down from 4,406 the previous week. This slight decrease mirrors the trend seen in the ICE market but underscores the EV market’s resilience.
The total number of EV listings stood at 133,765, representing a 3% decrease from the previous week. The average DOM for EVs increased to 69 days, reflecting a similar market slowdown as seen in the ICE segment.
EV Price Band Analysis
The pricing structure within the EV market shows a concentration in the mid to high range:
- £0-£10,000: 3,217 vehicles
- £10,000-£20,000: 25,553 vehicles
- £20,000-£30,000: 23,200 vehicles
- £30,000-£40,000: 11,705 vehicles
- £40,000-£50,000: 4,783 vehicles
- £50,000+: 4,503 vehicles
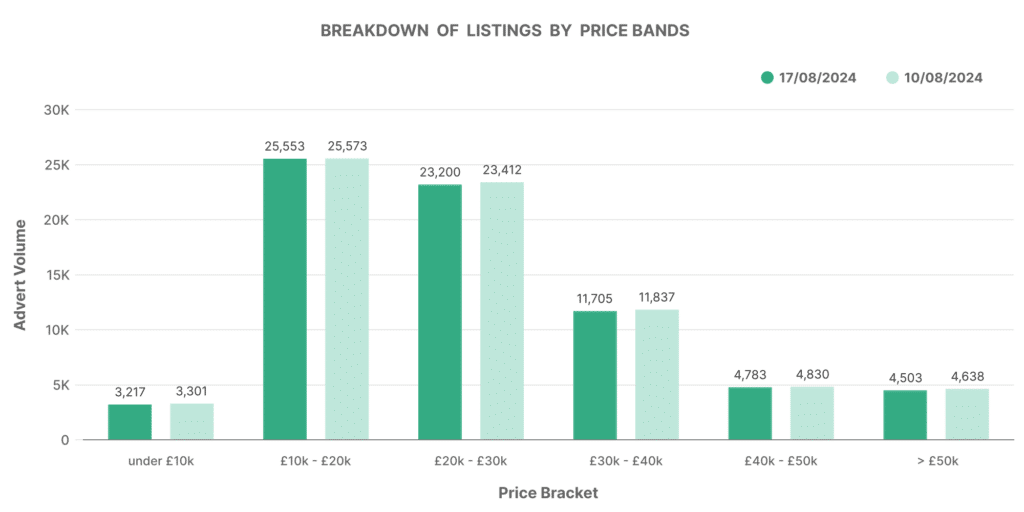
EVs listed between £10,000 and £30,000 make up the bulk of the market, similar to ICE vehicles. However, the higher price bands also hold a significant share, reflecting the generally higher cost of EVs.
Dealer Inventory and Volume Distribution in EVs
- 0-100 vehicles: 4,145 dealerships
- 101-250 vehicles: 450 dealerships
- 251-500 vehicles: 21 dealerships
- 500-1,000 vehicles: 12 dealerships
- 1,000+ vehicles: 11 dealerships
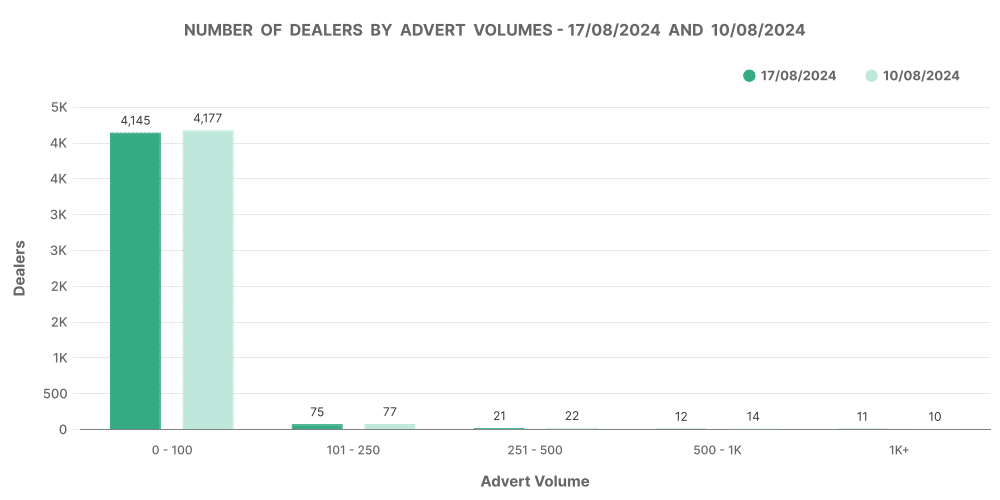
Like the ICE market, most EV dealers operate with smaller inventories. However, the distribution suggests that the market is still maturing, with fewer dealers holding large stocks.
Top 100 EV Dealers Analysis
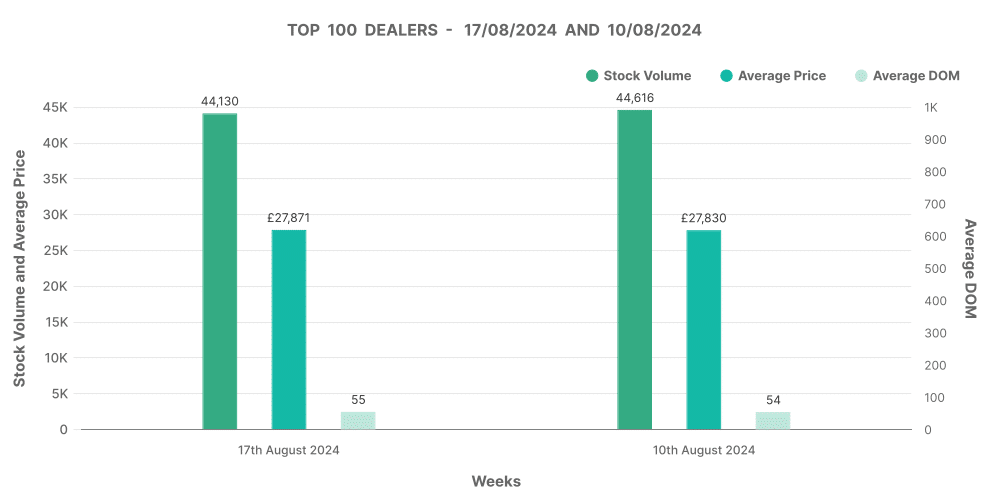
The top 100 EV dealers show a similar trend to their ICE counterparts, with a stock volume of 44,130 vehicles and an average DOM of 55 days. The average price within this segment is £27,871, considerably higher than the ICE market, reflecting the premium nature of many electric vehicles.
Comparative Analysis: ICE vs. EV Market
When comparing ICE and EV markets, a few key trends emerge:
- Market Share: EVs represent 12.42% of the overall used car market, while ICE vehicles make up 87.58%. This market share is consistent with the ongoing transition to electric, though ICE vehicles still dominate.
- Average Price: The average price of EVs is £27,253, significantly higher than the £16,790 average for ICE vehicles. This price difference reflects the higher initial cost of EVs and their growing demand as consumers seek more sustainable options.
- Days on Market: EVs sell slightly faster than ICE vehicles, with an average DOM of 69 days compared to 84 days for ICE. This could be due to the increasing consumer interest in electric vehicles, despite their higher price points.
How Marketcheck UK Supports Your Dealership
Understanding the dynamics of the used car market—whether ICE or EV—is crucial for automotive dealers looking to maximise profitability. Marketcheck UK offers comprehensive data tools that allow dealers to track trends, monitor pricing, and optimise their inventory strategies in real time.
With access to detailed breakdowns of listings by price bands, analysis of top dealers, and insights into both ICE and EV markets, Marketcheck UK empowers dealerships to make informed decisions that align with market trends. Whether you’re looking to refine your pricing strategy, adjust your inventory, or explore new opportunities in the EV market, Marketcheck UK provides the data and tools you need to stay competitive.
By leveraging Marketcheck UK’s services, your dealership can navigate the complexities of the used car market with confidence, ensuring that you’re always ahead of the curve. Our platform offers insights that are not just data points but actionable intelligence—designed to drive your business forward.
Next week: 24th August | Previous week: 10th August
