UK Weekly Used Car Market Data – 2nd November 2024
Interpreting market trends is a valuable asset for automotive industry professionals. By understanding these trends, dealerships, especially those dealing with internal combustion engine (ICE) vehicles and electric vehicles (EV), can refine their strategies, making informed decisions that could stimulate growth. This report will study various data sets from the used car market in the UK, focusing on both ICE and EV sectors, to deliver comprehensive automotive market insights.
Understanding ICE and EV Price Bands
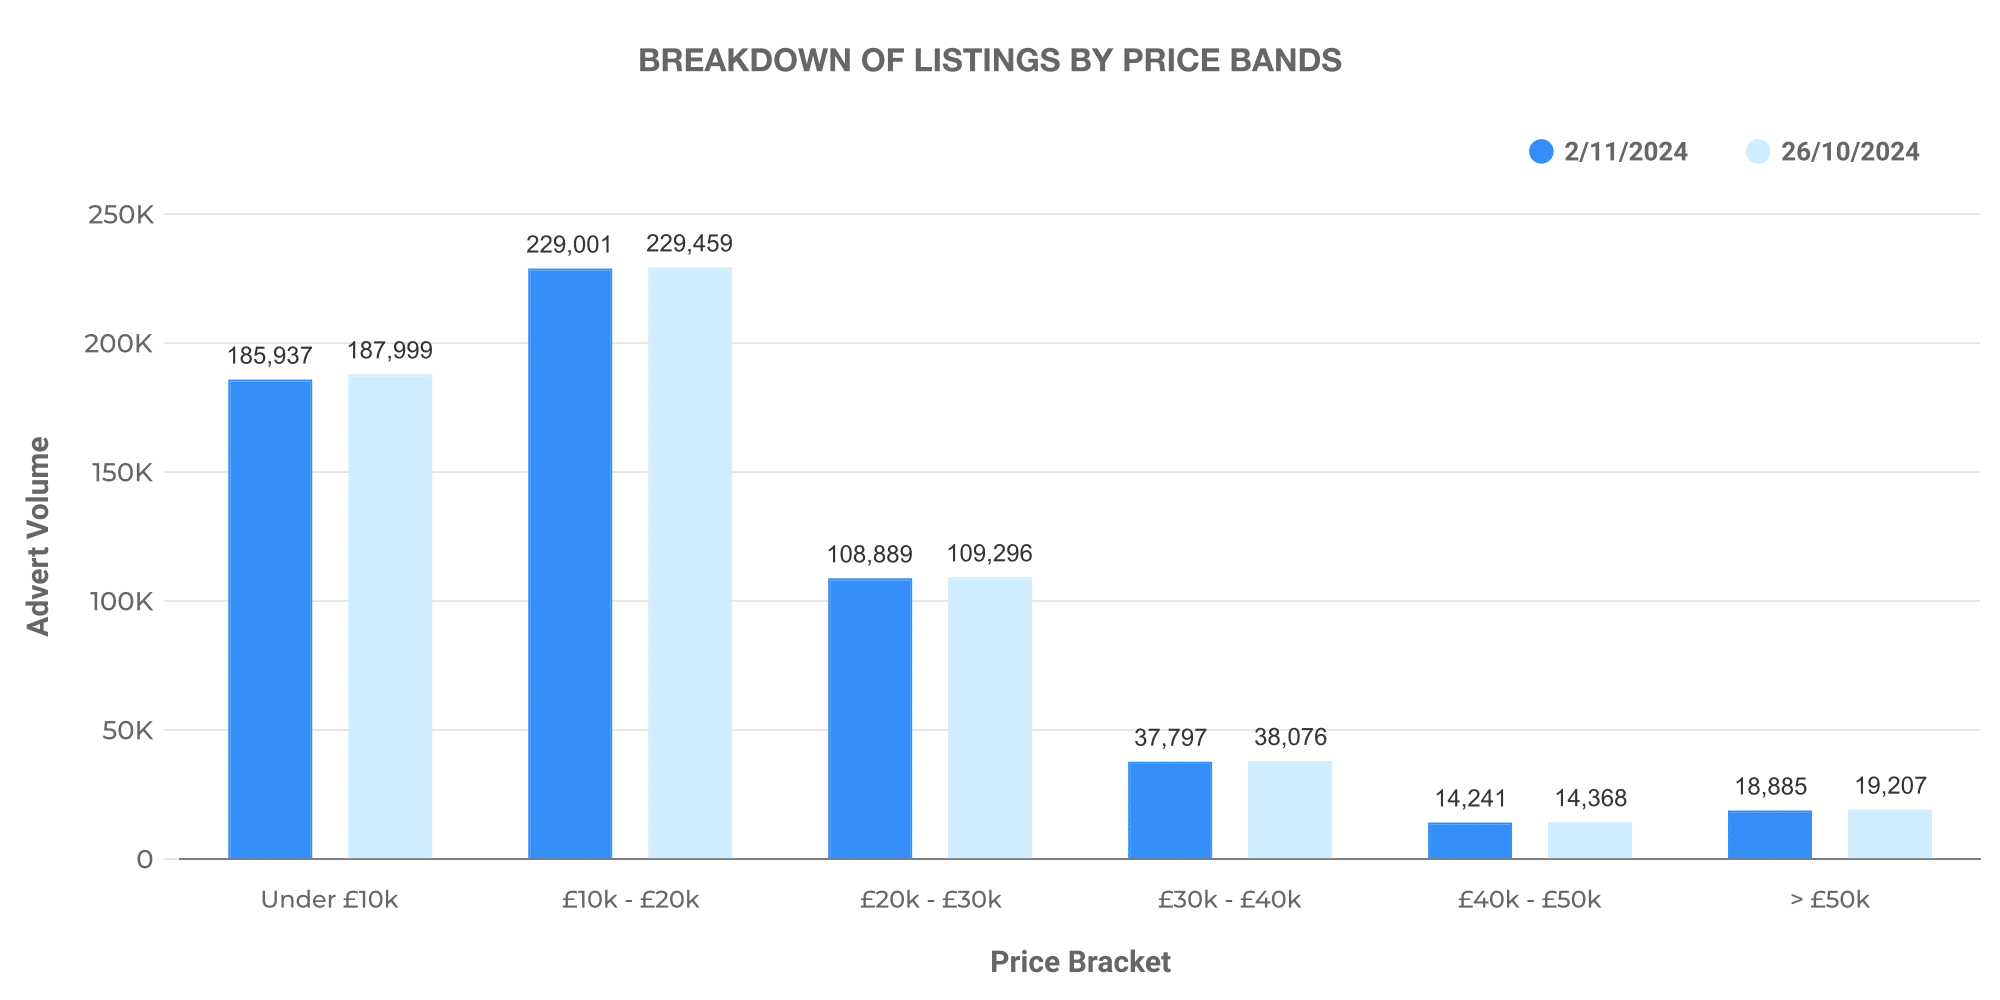
Aggregating statistics between 19th October and 2nd November 2024 uncovers intriguing information about the used car market in the UK. For ICE vehicles, the total listings stood at 611,354 in the first week, slightly reducing to 607,778 in the following week. The majority of these listings, both weeks, fell within the £10,000 to £20,000 price band.
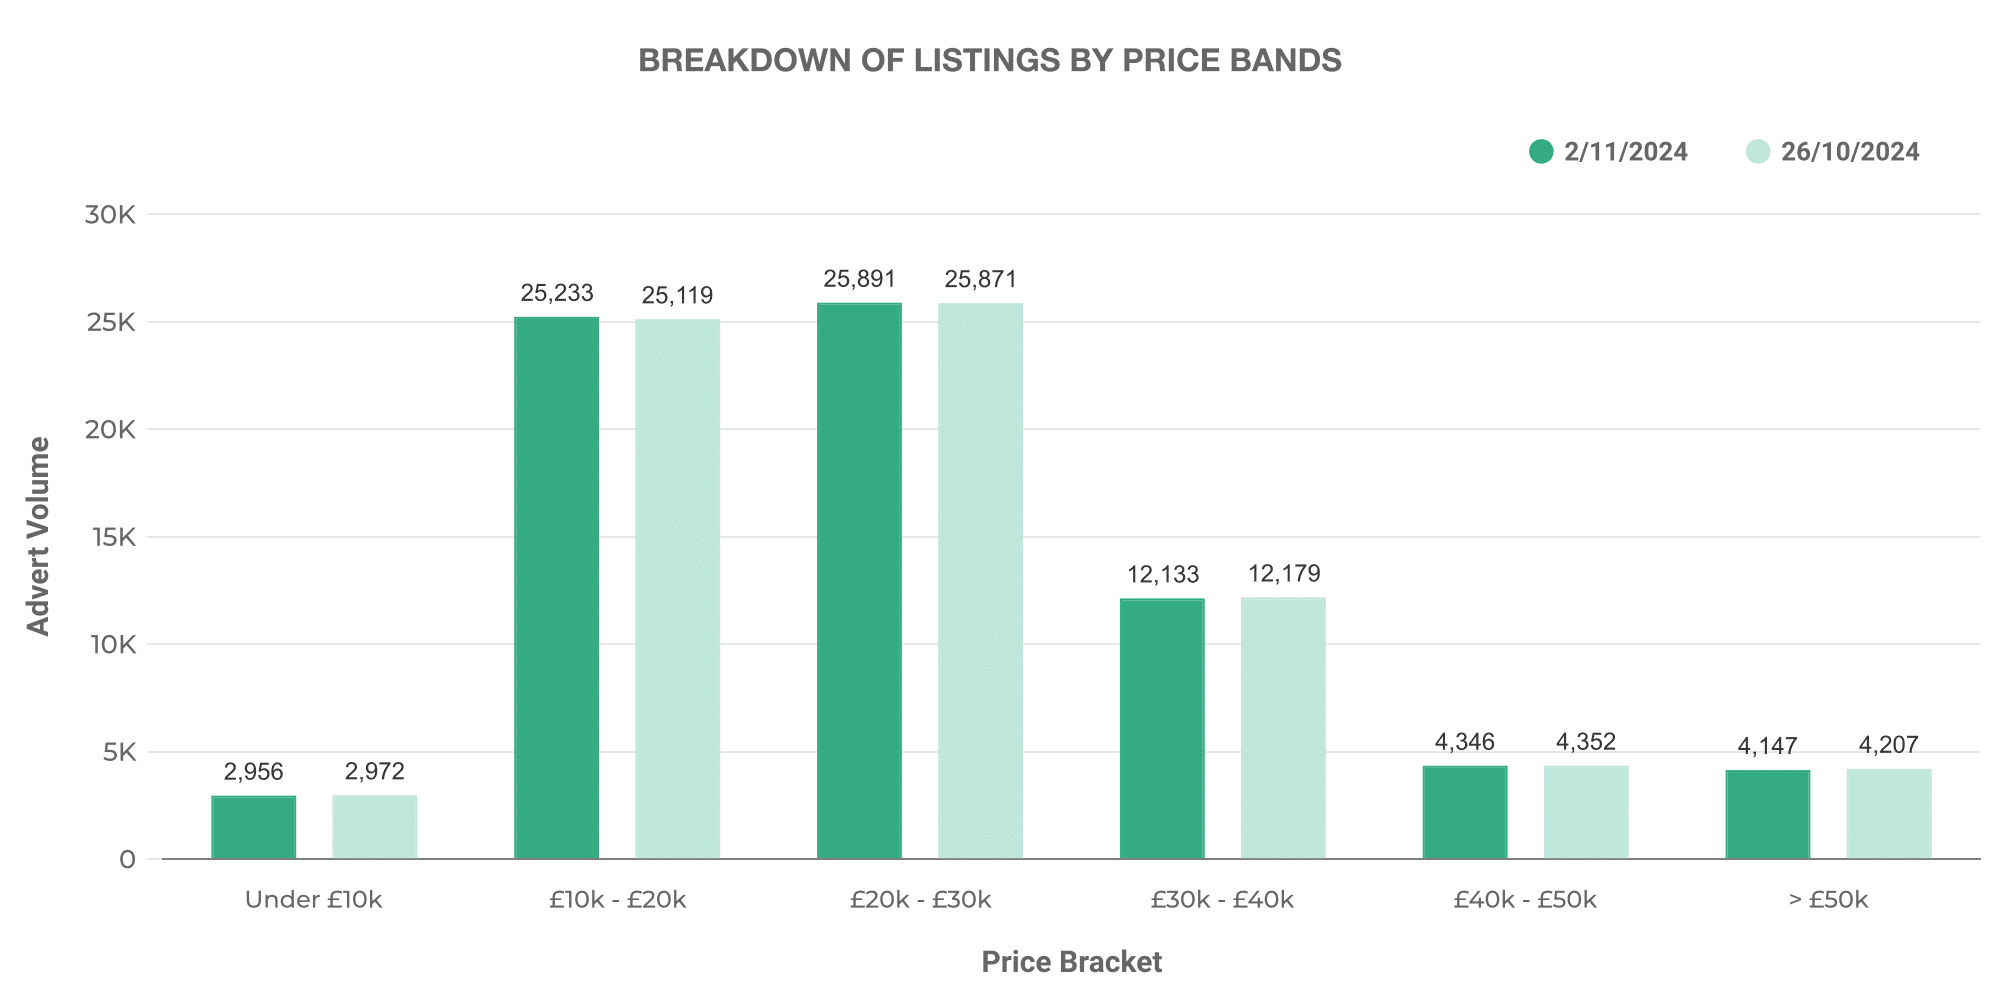
When it comes to EVs, the data shows steady numbers, with 75,879 listings for both recorded weeks. Much like the ICE sector, these listings were predominantly found in the £10,000 to £20,000 price band.
Comparison: ICE vs EV
In the week ending 26th October, the average list price for ICE vehicles was about £18,344, decreasing marginally to £18,336 in the week ending 2nd November. In contrast, the average price for EVs maintained a significantly higher range, starting at £27,043 and minimally reducing to £26,977 by the end of the analysed period.
Comprehending Dealer Volumes
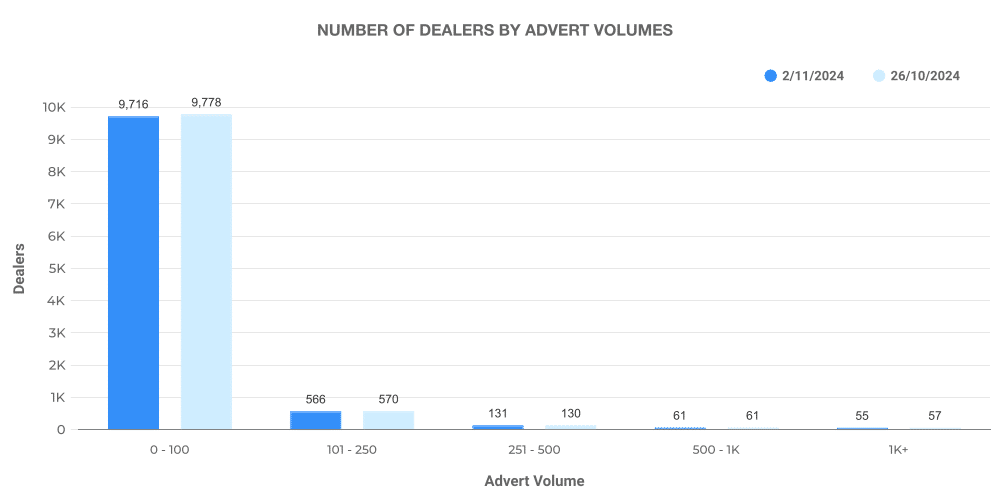
Analysing the volume of ICE vehicles at various dealer rooftops reveals a slight decrease from 14,746 to 14,538 from the first to the second week. Regardless, most dealerships listed between 0 and 100 vehicles consistently across both weeks.
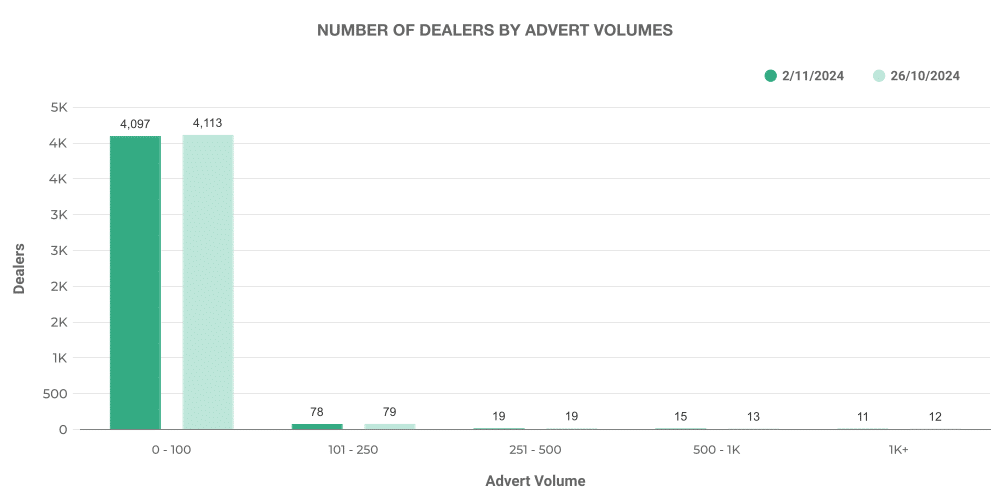
With fewer dealer rooftops than the ICE market, the EV sector demonstrated interesting findings. Starting with 7740 total EV dealer rooftops in the first week, a slight decrease of 99 was observed in the second week. Similar to ICE, the majority of dealers listed between 0 and 100 vehicles.
Analysing Top 100 Dealers by Volume
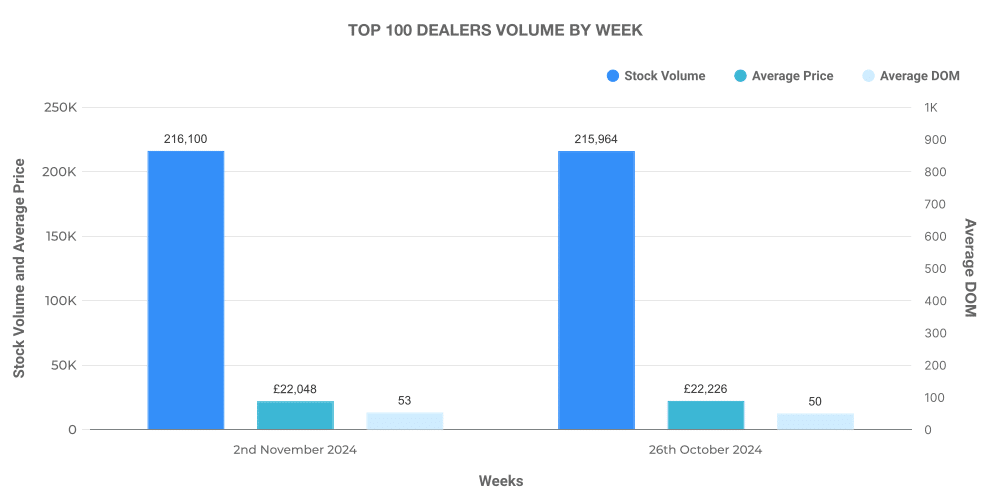
When evaluating the top 100 dealers by volume, the ICE sector displayed a slight increase in this subset’s inventory volume, growing from 215,964 to 216,100 in the week ending 2nd November. This top 100 accounted for an average list price that was slightly above the market average.
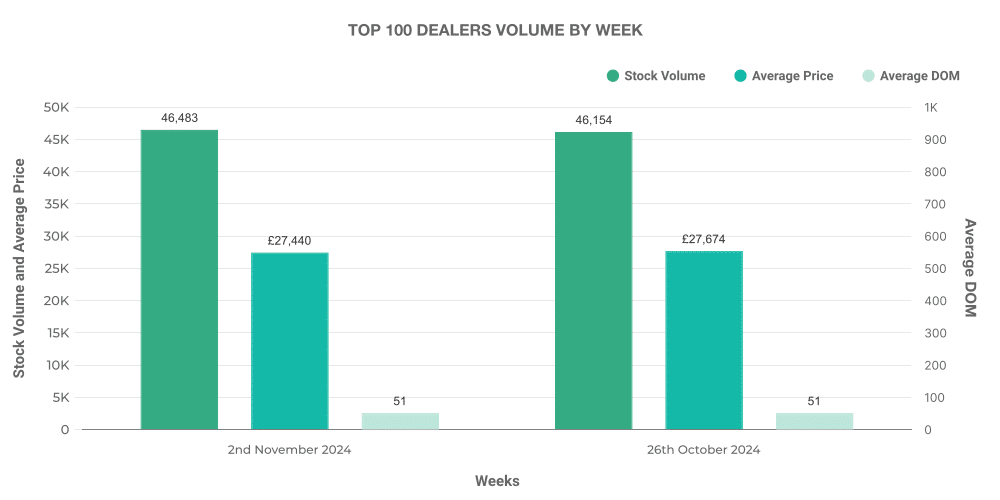
Similarly, the top 100 EV dealers also demonstrated a slight increase in inventory from the first to the second week, albeit with a lower overall volume when compared to the ICE sector. This group accounted for 18.7% of total EV listings, with an average price slightly higher than the market average.
Top-performing EV Models in the Market
Insights into the top 10 advertised EV models revealed the Toyota Yaris and Toyota C-HR as consistent best-sellers throughout the week ending 2nd November 2024.
Through comprehensive automotive market insights, professionals in the UK automotive sector can effectively optimise their strategies, ensuring a positive impact on growth and customer satisfaction. This analysis acknowledges the room for growth in the EV sector, making it a promising avenue for car dealers to investigate further. By staying abreast of these trends and interpreting weekly data reports, dealers can ensure a profitable and sustainable business model amidst the dynamics of the used car market.
Next week: 9th November | Previous week: 26th October
