UK Weekly Used Car Market Data – 9th November 2024
Navigating through the labyrinth of the used car market should be a primary focus for all automotive dealers. Along this journey, dealers leverage market insights to refine their strategies and aim for growth. Our analysis takes a closer look at the data among both combustion engine vehicles (ICE) and the burgeoning electric used car market (EV). By understanding the trends in the UK automotive sector, dealers can equip themselves with the necessary knowledge to manoeuvre smoothly.
The Current Snapshot of the Electric Used Car Market
Over time, the electric used car market has been experiencing a steady progression, highlighting a significant shift in purchasing patterns. As we reach the end of the week on the 9th November 2024, let’s unfold the crucial statistics that marked this week.
For the week ending on 9th November, the market registered a total of 76,848 listed used electric vehicles (EV), exhibited by 4,369 dealers.
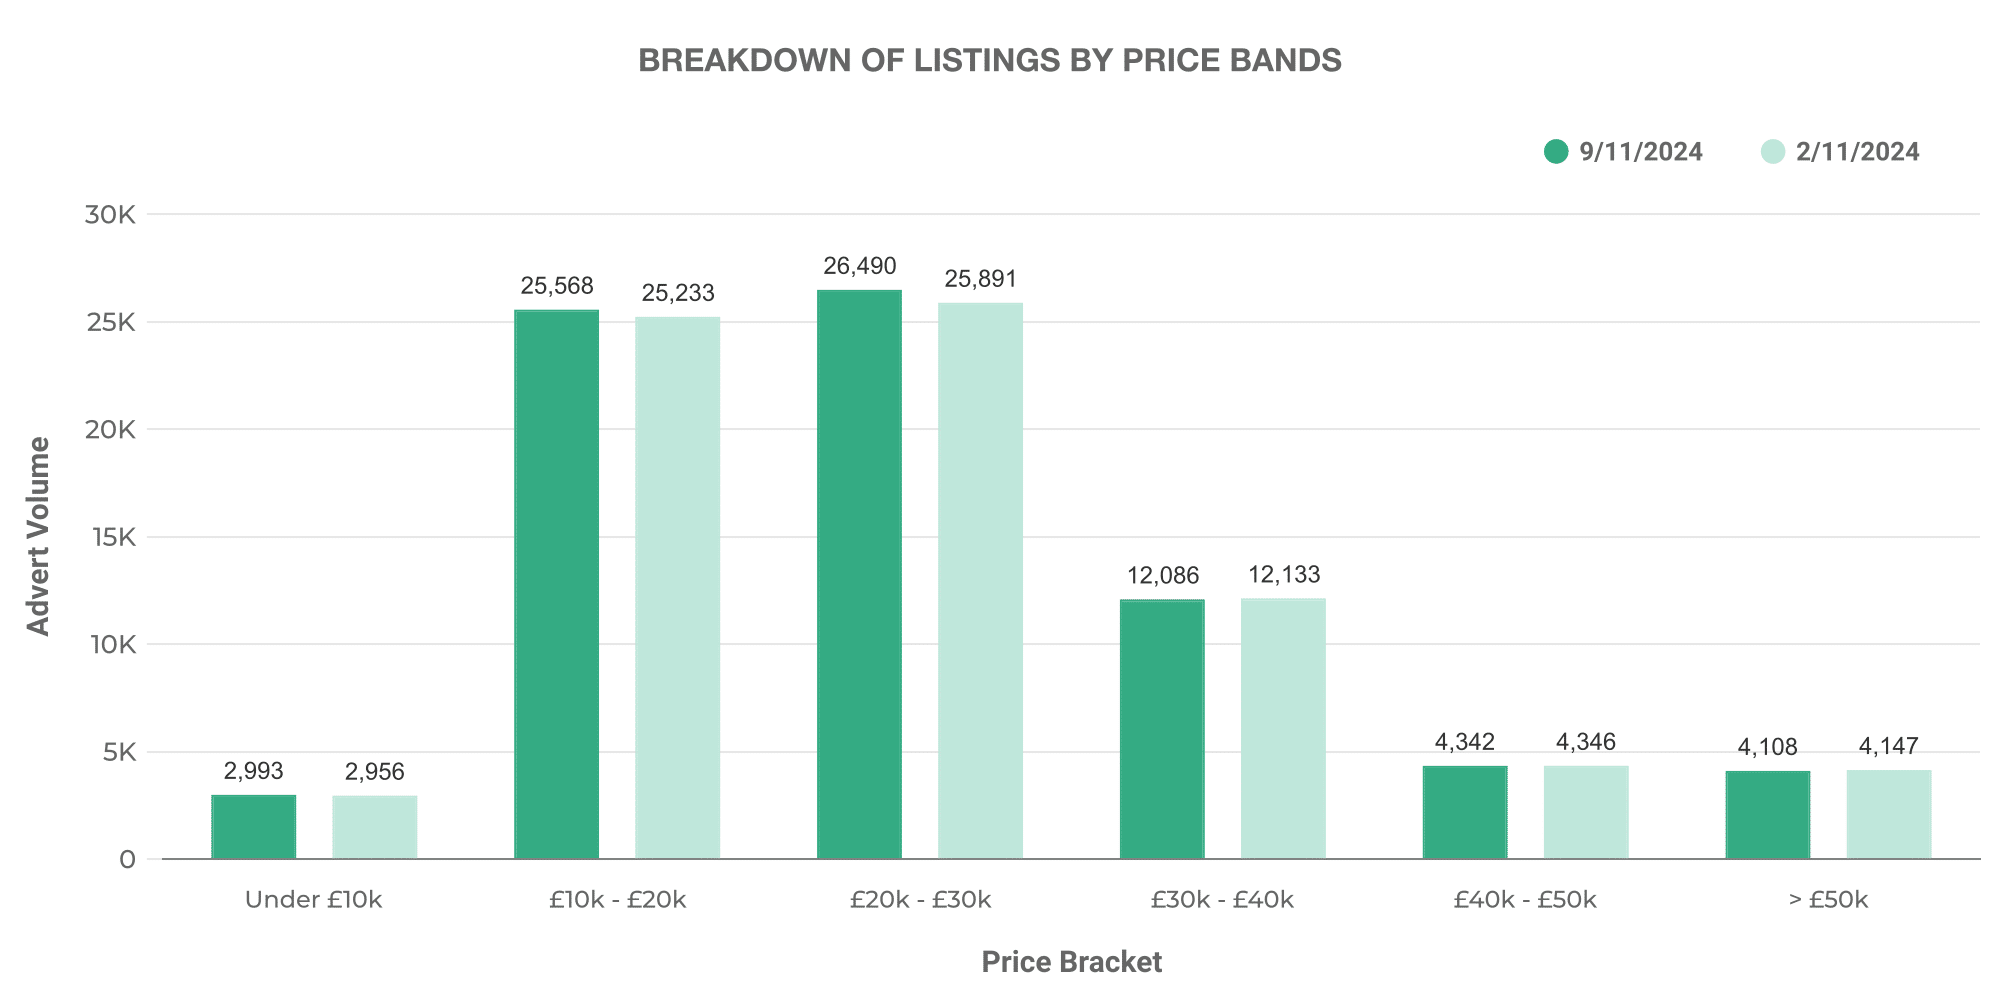
The graph above showcases the pricing brackets of these listed EVs. Majority of EVs are priced within the £10,000 – £20,000 range, followed by a substantial number of vehicles listed within the £20,000 – £30,000 range. Interestingly, we also noted some luxury models costing above £50,000 adding to the market.
The mounting diversity in EV pricing signifies the expansion of the EV market, accommodating vehicles of different models, specifications and functionalities to meet varied customer needs.
When analysing alongside the conventional Internal Combustion Engine vehicles (ICE), which in the same period was listed by 10,546 dealers totalling 608,591 cars, the EV sector tells a tale of continued growth.
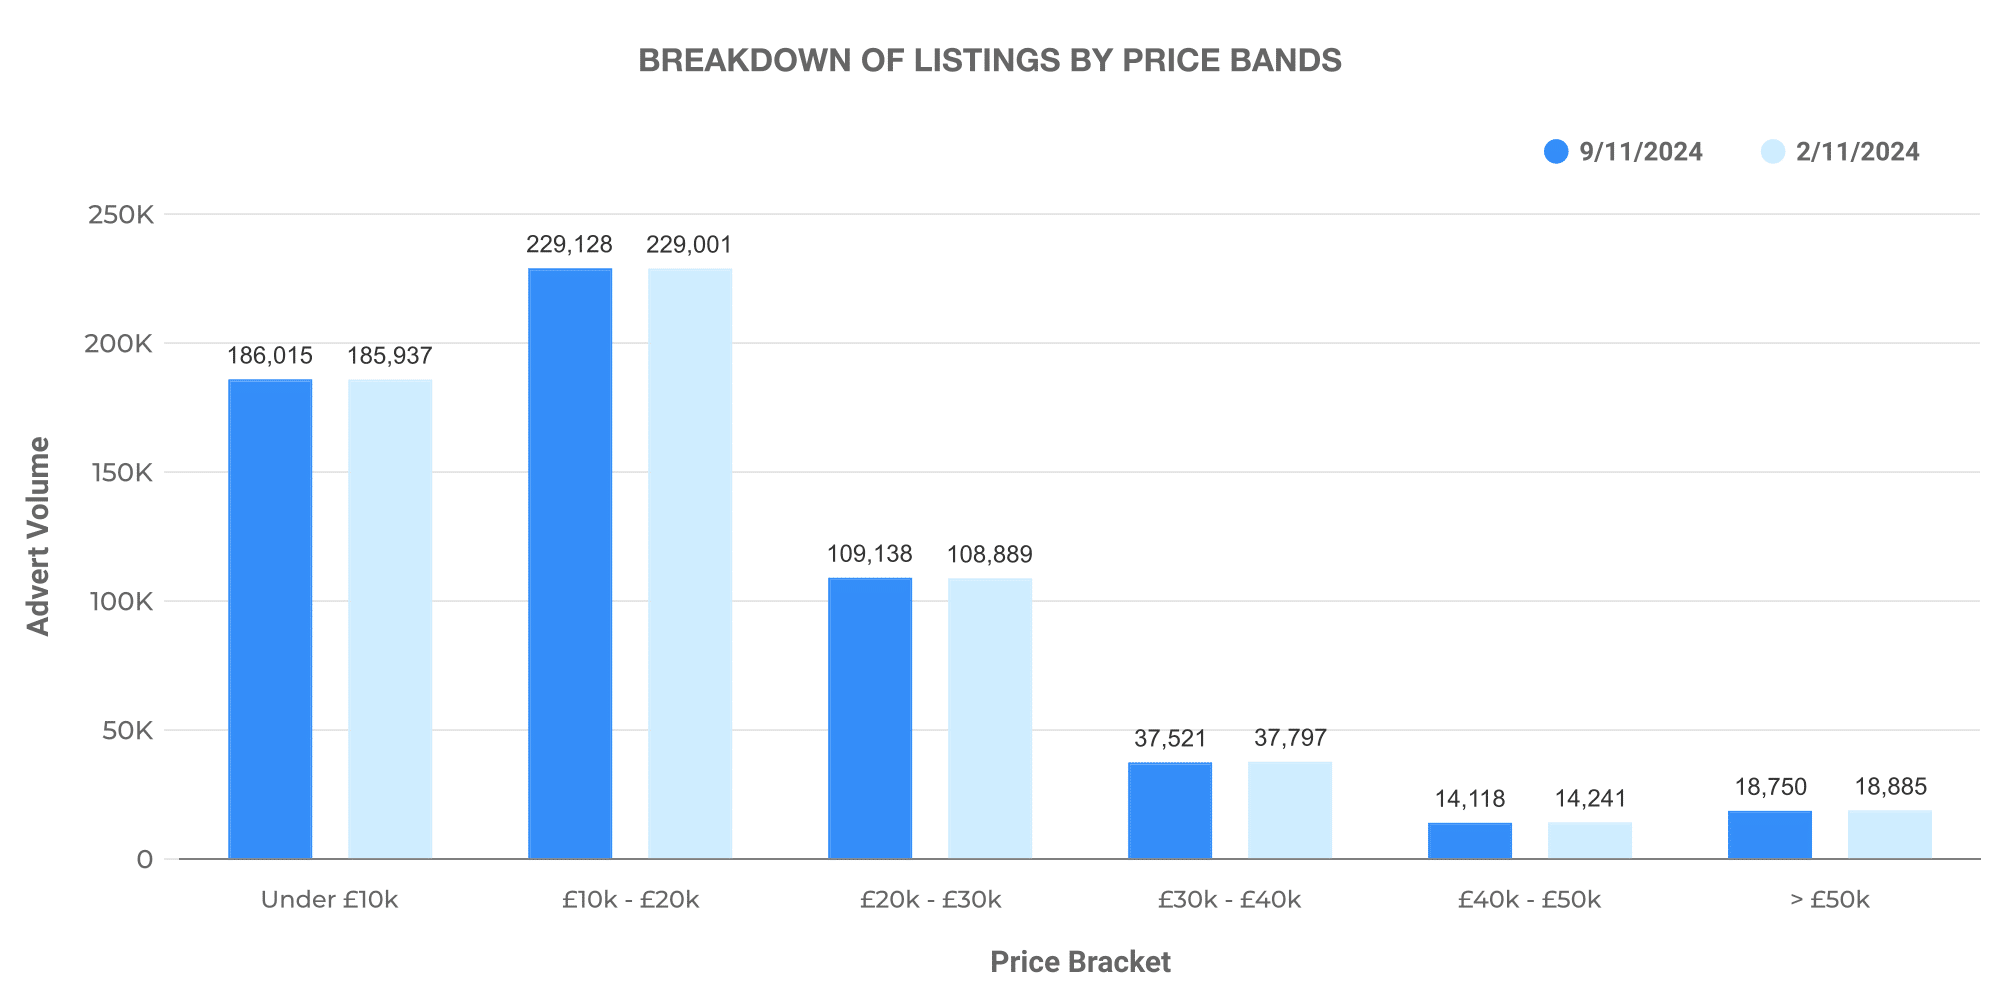
Examining Dealer Volumes
A more insightful understanding can be gained when we analyse dealer volumes.
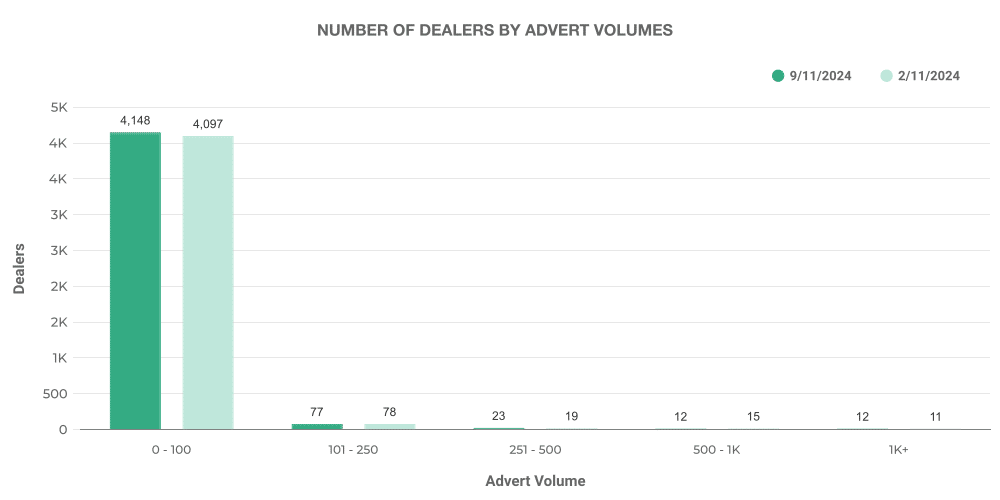
Logically, with EVs being a fairly emerging market compared to ICE vehicles, most dealers had listed between 0-100 EVs. However, there is progress and we can see a positive trajectory towards EVs.
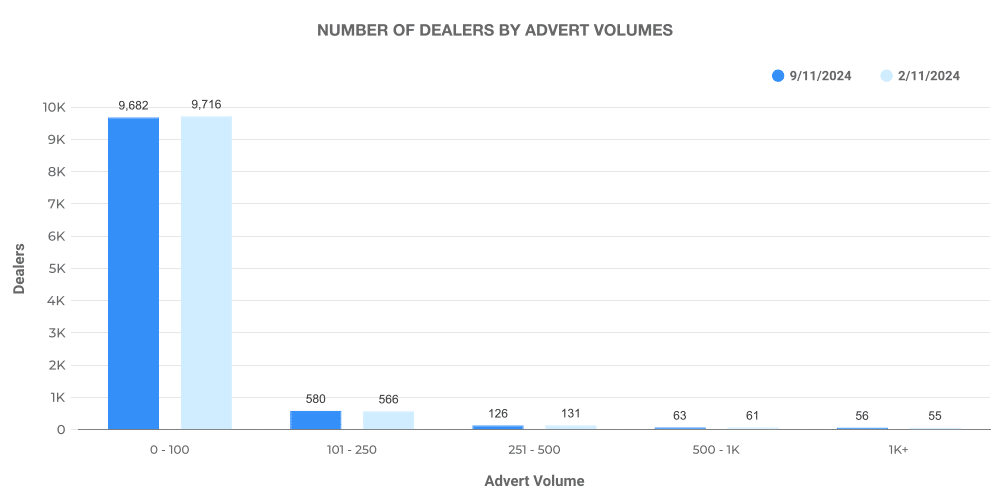
As for ICE vehicles, the listing volumes were more evenly distributed among the dealers, reinforcing the maturity of this market where dealerships of varied sizes participate.
Top 100 Dealers: ICE vs EV
One insightful comparison involves the analysis of the top 100 dealerships by listing volume for both EVs and ICE vehicles.
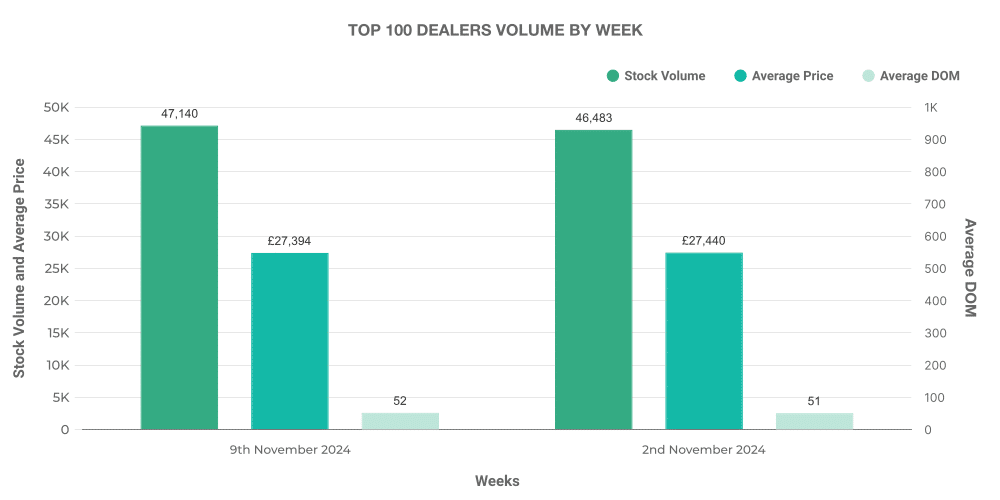
For EVs, the cream of the crop, or the top 100 dealers, contributed to 18.7% of the total EV listings, with an average price slightly higher than the market average.
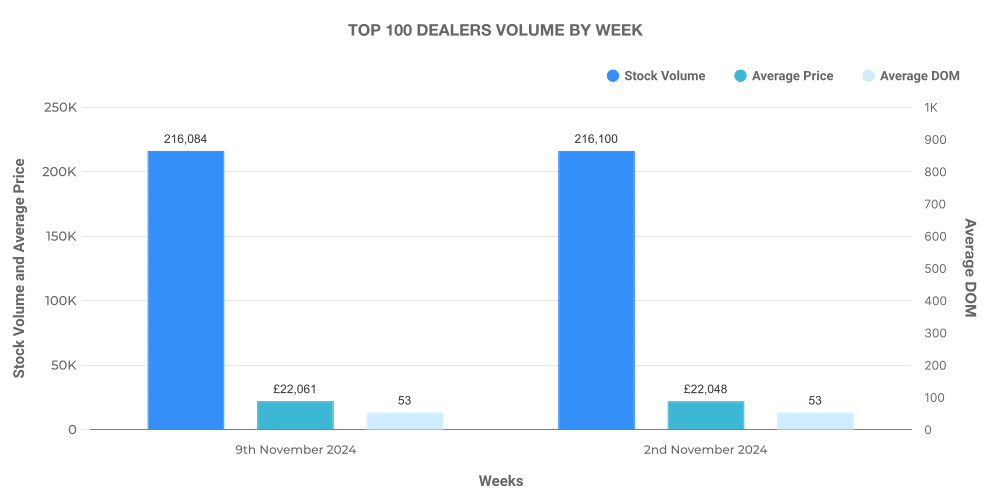
On the opposing side, in the ICE market, the top 100 dealers accounted for 15.5% of total listings, very similar to the EV market, with vehicles being sold at an above-average market price.
Comparison: ICE vs EV
In conclusion, while the conventional ICE market remains substantial, the EV market is gaining steam at a notable pace. Keeping an eye on the used car market trends, especially the electric used car market and the UK car price trends, enables us to navigate this dynamic landscape successfully.
As buyers recognise the long-term benefits of EVs such as lower maintenance costs, tax benefits and environmental considerations, we can expect the EV share to rise. The future of the used car market in the UK and across the globe is shaping to be electric. By aligning strategies with this market shift, businesses can facilitate their transition towards a greener and more profitable future.
Next week: 16th November | Previous week: 2nd November
