UK Weekly Used Car Market Data – 16 November 2024
The used car market is dynamic and subject to frequent change. As such, active monitoring and utilising this knowledge is vital to the success of car dealerships, insurance companies, investment firms, and car finance lenders. In this report, we at Marketcheck UK will offer an analysis of used car market data, with a specific focus on electric used car comparisons, UK car price trends, and vital automotive market insights that can guide strategic decision-making.
The Used Car Market (ICE)
Total dealership listings in the Internal Combustion Engine (ICE) used car market saw a marginal rise in the period from 2nd November 2024 to 16th November 2024. The volume increased from 608,591 to 612,076, a jump of roughly 0.6%. Total dealership numbers remained relatively stable, from 10,546 to 10,540, while the average price saw a slight dip from £18,289 to £18,279.
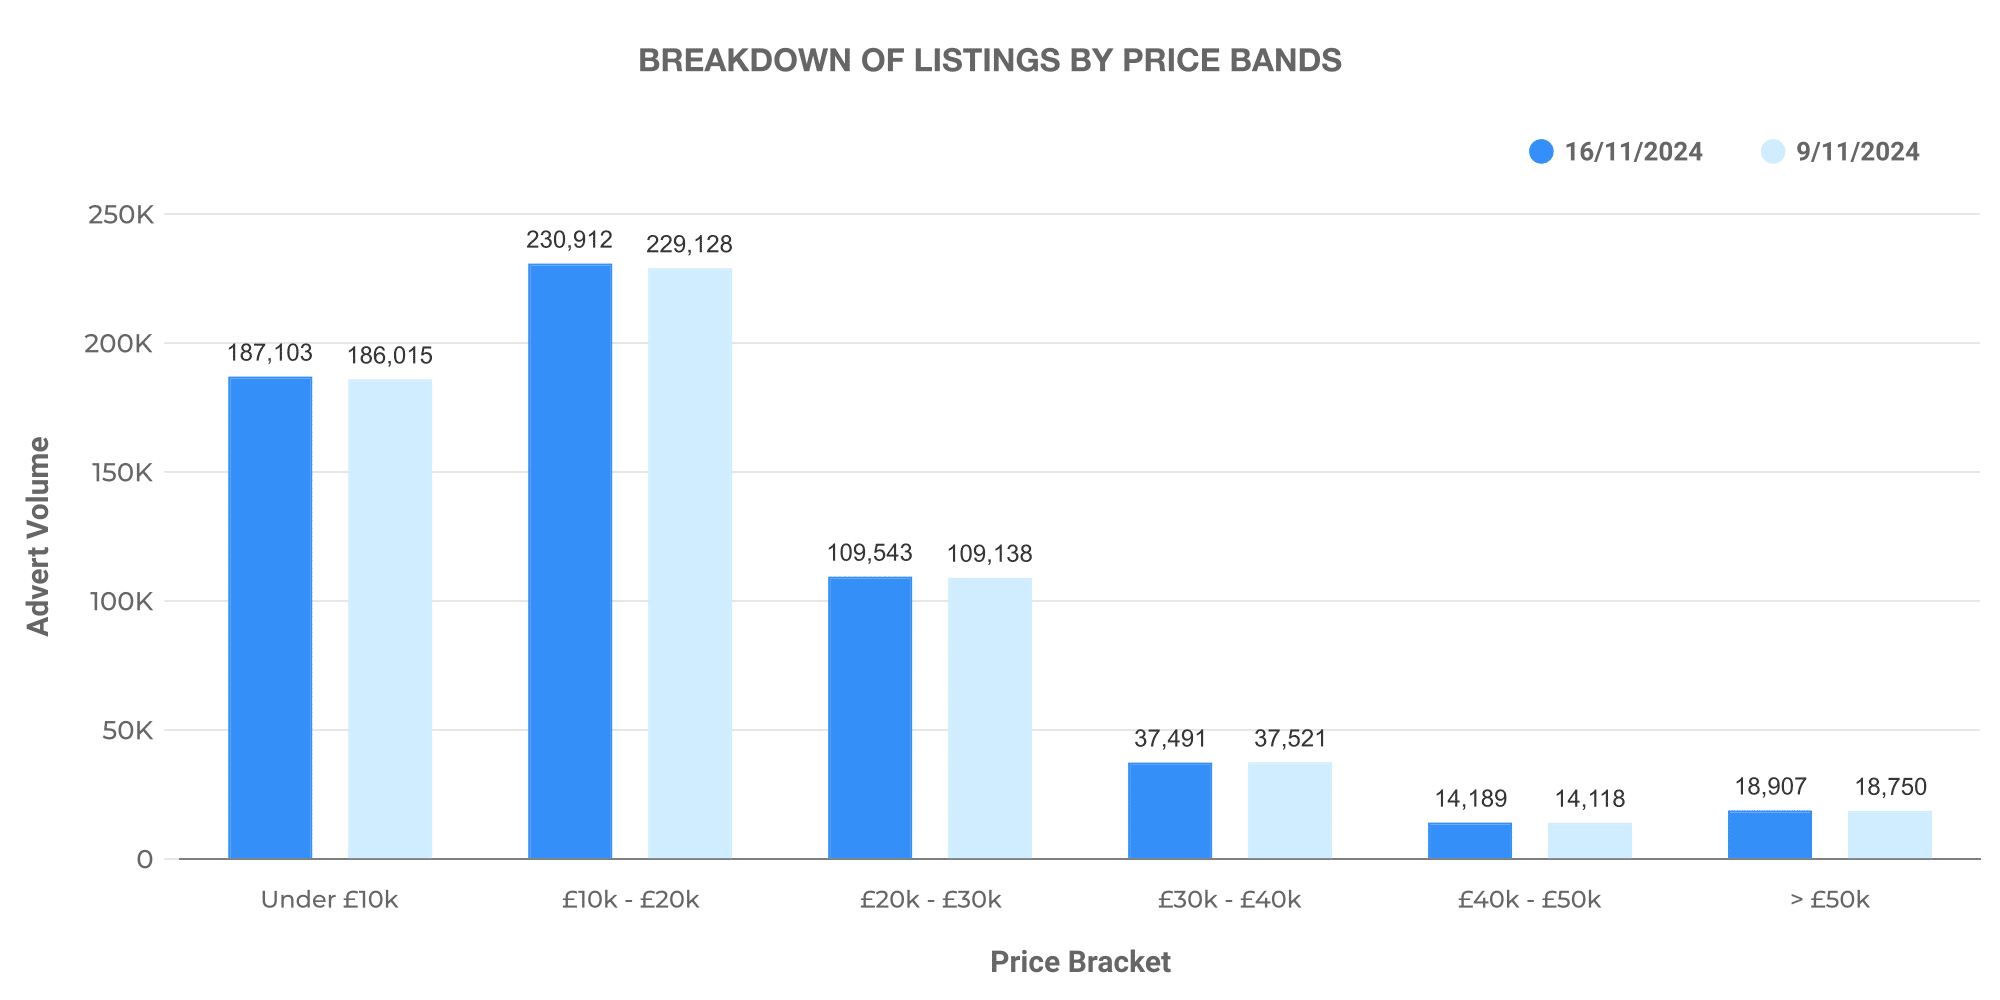
The above graph presents a breakdown of used car listings by price bands for the fortnight. The trend, however, remains consistent from the previous week, with most cars falling within the £10,000 – £20,000 range.
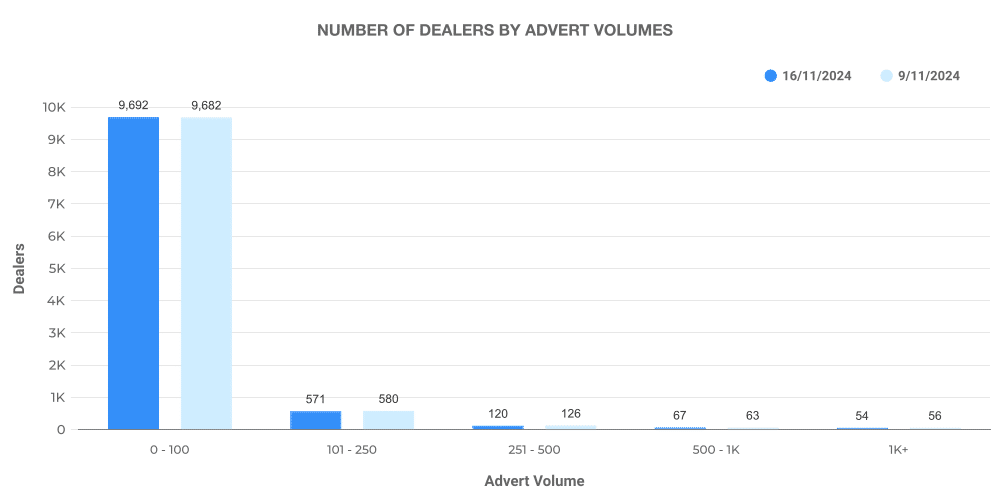
The above figure demonstrates the used car dealership volumes based on the number of adverts. This trend helps further understand the investment levels and challenges across different dealership sizes.
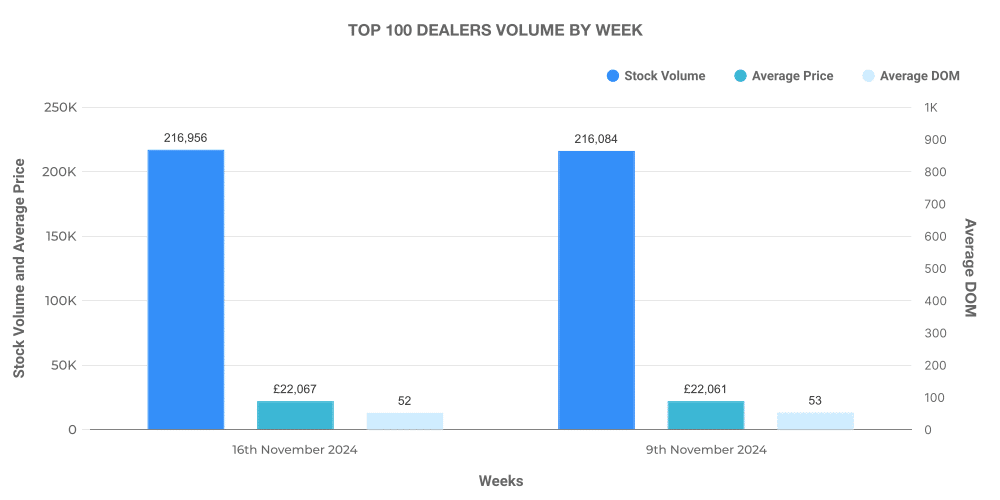
The above graph notes that the top 100 dealers in the ICE market accounted for 15.5% of total listings. The ICE vehicles marketed by these businesses carried an above-average market price.
Electric Used Car Market (EV)
The electric used car market is growing from strength to strength both in terms of dealership numbers and listings. From 2nd November to 16th November 2024, dealer numbers grew from 4,369 to 4,382, while total listings increased by about 1.4%, from 76,848 to 77,941. Interestingly, their average price saw a slight increase from £26,834 to £26,865.
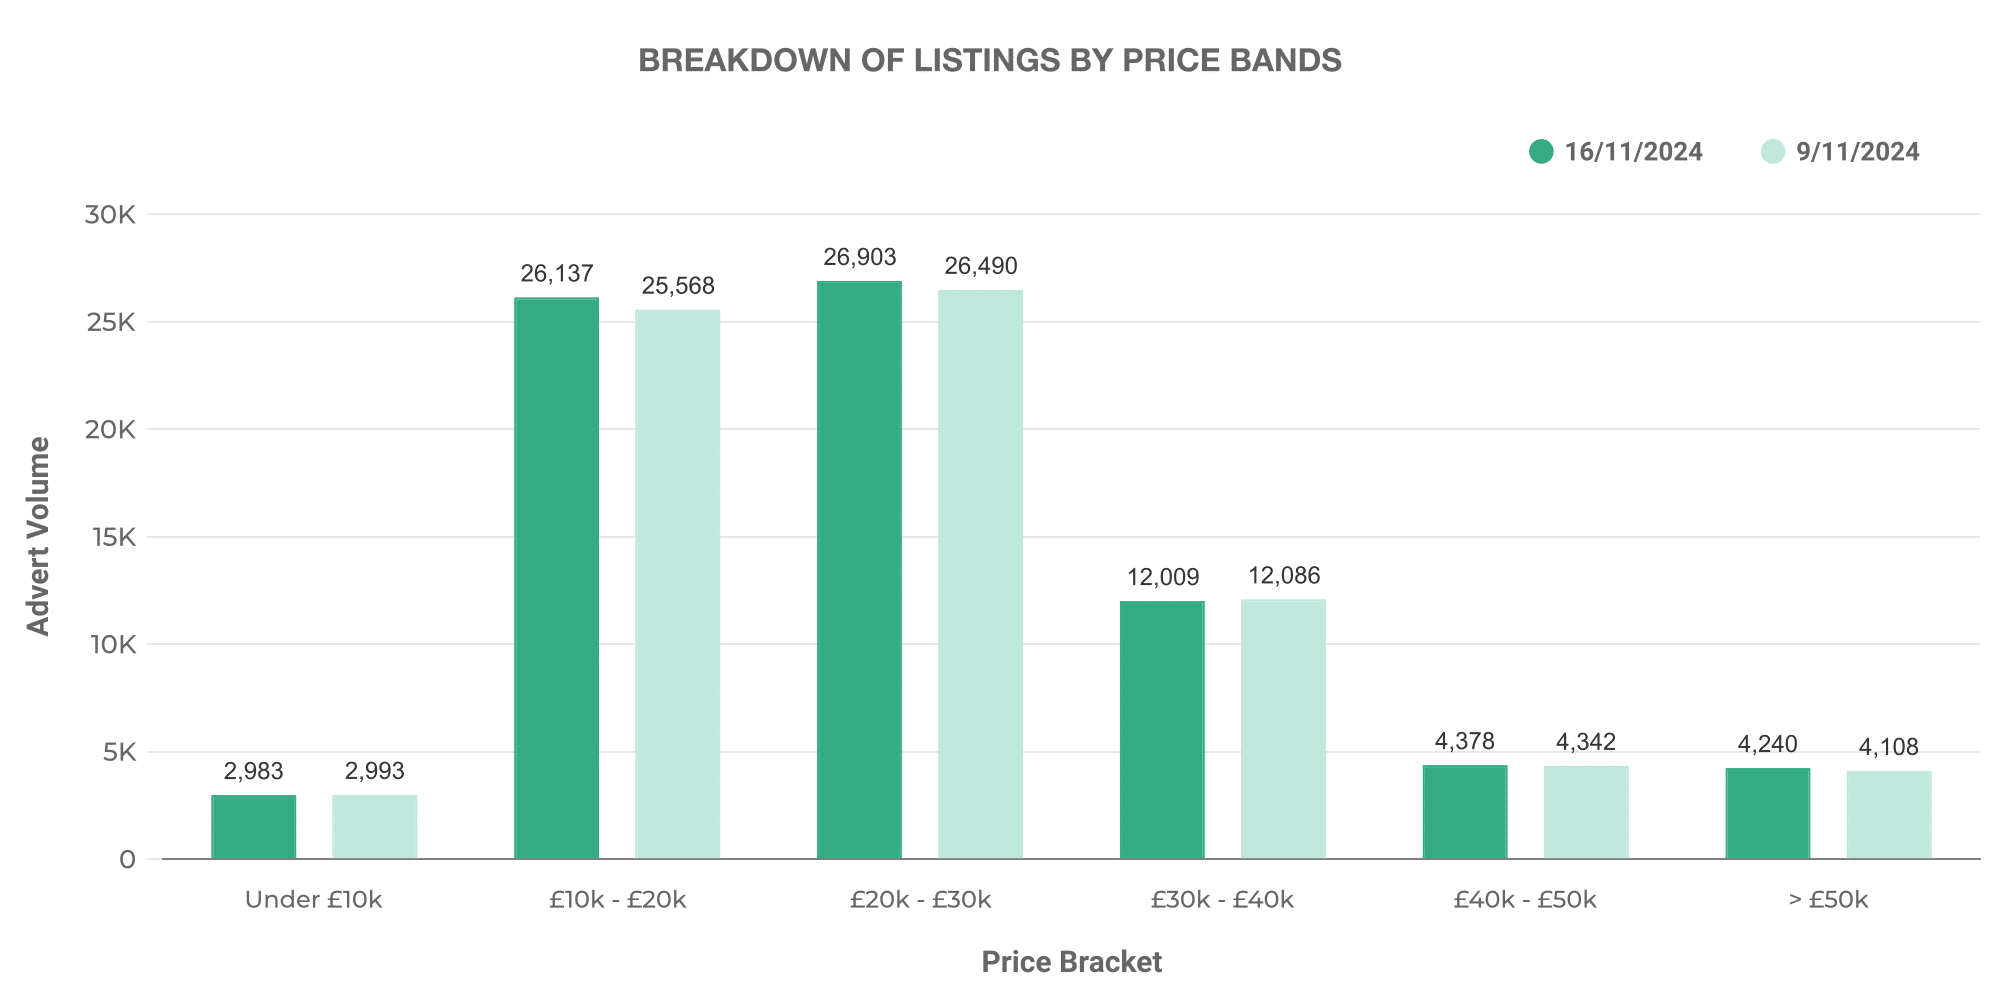
The chart above denotes a spread of used EV listings by price bands. Still, we notice that used EVs are a diverse marketplace, accommodating vehicles with a range of pricing options.
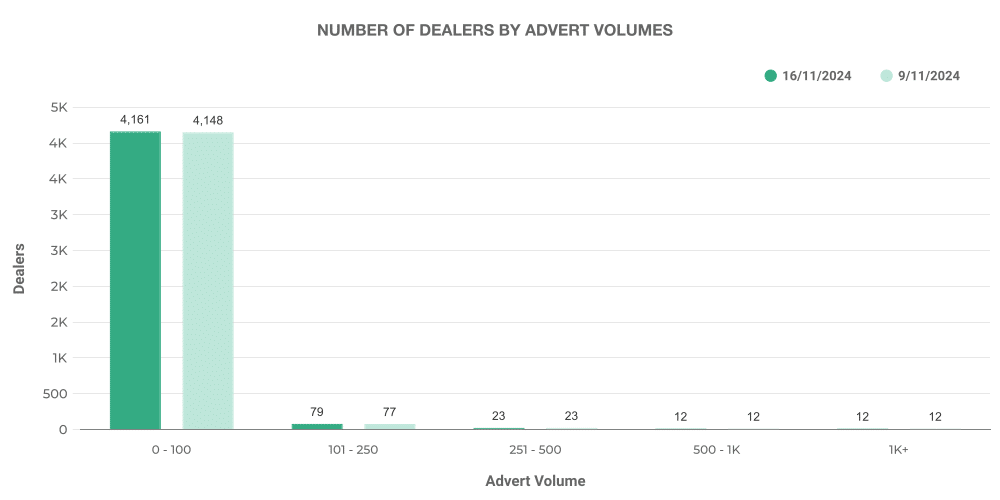
Analyzed above is the breakdown of used EV dealership volumes based on their advert numbers. This data provides a separate perspective on dealership size and listing quantities, which paints the landscape of the EV marketplace.
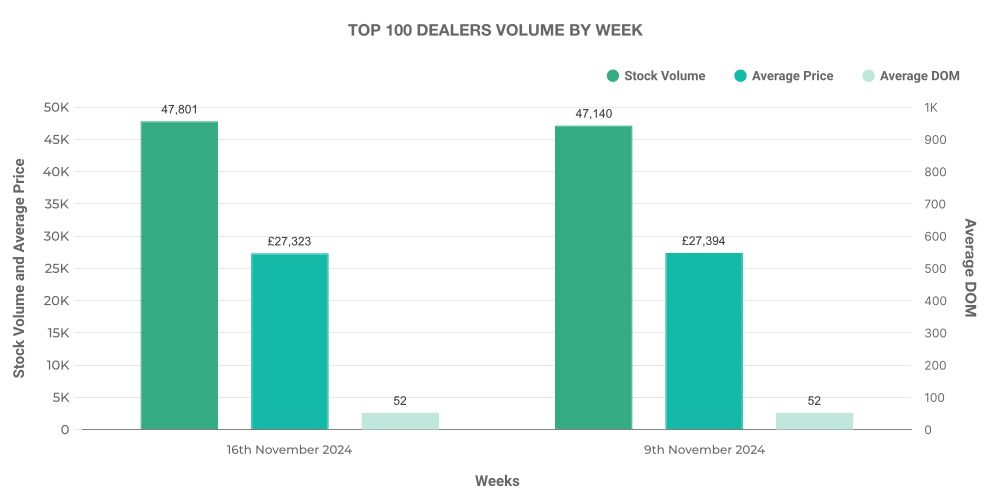
Interestingly, the top 100 dealers accounted for 18.1% of total EV listings, slightly higher than ICE vehicles.
Comparison: ICE vs EV
The last two weeks saw the used EV market edge slightly upwards from 12.63% to 12.73% of the total used car market. As such, the percentage of non-EVs decreased from 87.37% to 87.27%. While the shift is slight, it continues to reflect the growing trend towards used electric cars.
The average prices of EVs stayed ahead of their ICE counterparts. For the reported period, the average price for EVs was noted at £26,865 versus £17,279 for ICE cars. This reflects the premium nature of electric vehicles currently and a higher brand value associated with them.
Top 10 Adverts by Make & Model
To add another layer of insight, let’s consider the make and model data for both the ICE and EV category. Among EVs, ‘Toyota Yaris’ boasted the most listings, followed by ‘Toyota C-HR,’ ‘KIA Niro,’ ‘Toyota Corolla,’ and ‘BMW 3 Series.’ Among ICE vehicles, ‘Ford Kuga’ led the way, closely tailed by ‘Toyota RAV4,’ ‘Hyundai Kona,’ ‘Tesla Model 3,’ and ‘Hyundai Tucson.’
Next week: 23rd November | Previous week: 9th November
